
Fig. 1.
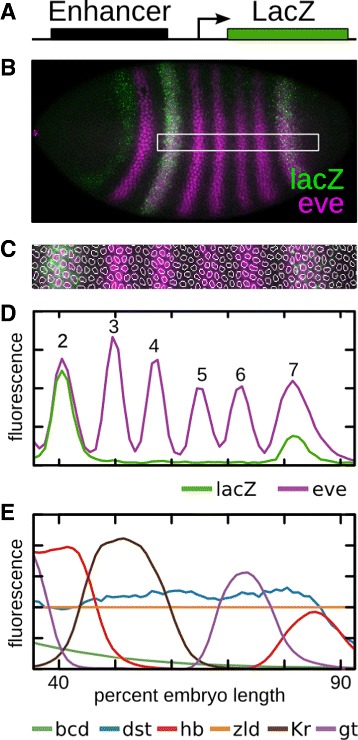
Enhancer quantification. a Regulatory sequences are cloned upstream of a lacZ reporter into the AttP2 site [36]. b Embryos are stained using fluorescent in situ hybridization (FISH) for lacZ and antibody staining for eve and imaged using confocal microscopy. c Nuclei are identified and levels of lacZ and eve are taken in a 10% DV stripe from 35.5% to 92.5% embryo length along the anterior-posterior axis at nuclear cycle 14, time class 6 [38]. d Multiple embryos are quantified to give an average expression level for any given enhancer along the AP axis. The identity of eve stripes 2 through 7 are indicated. e Previously quantified levels of transcriptional regulators are shown [16, 17, 25]