
Fig. 4.
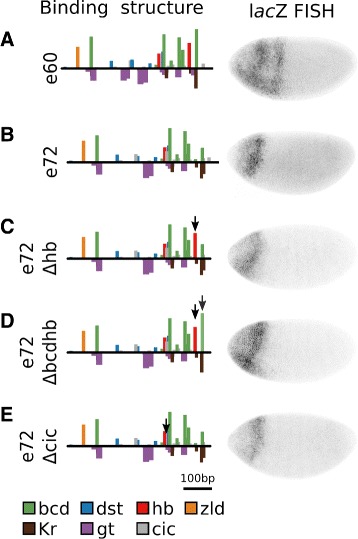
Known motifs cannot explain loss of expression after 60 LE. For each sequence, the binding structure structure is shown (left). Height of bars is proportional to LLR of binding for each motif. A subset of motifs are shown. Binding sites for all factors considered in this work are included in Additional file 1: Figures S5-S15. We also show FISH for lacZ driven by each of the sequences (right). a e60. b e72. This sequence is only 12 bp different than e60. c e72 with the affinity for a Hb site (arrow) restored to levels in e60. The construct does not drive expression. d e72 with the affinity for a Hb site and Bcd motif (arrows) restored to levels in e60. The construct does not drive expression. e e72 with the a Cic motif (arrow) removed, as in e60. The construct does not drive expression