
Fig. 6.
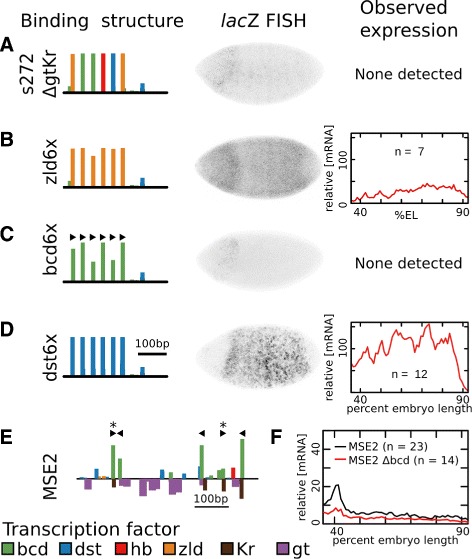
Homotypic clusters of Zld and Dst, but not Bcd drive embryonic expression. a-d For each sequence, the binding structure structure is shown (left). Height of bars is proportional to LLR of binding for each motif. A subset of motifs are shown. Binding sites for all factors considered in this work are included in Additional file 1: Figures S5-S15. We show FISH for lacZ driven by each of the sequences (center). We also show the quantitative level of mRNA driven by each enhancer along a 10% DV stripe from 35.5% to 92.5% embryo length (right). Data represents an average of n images, where the value of n is indicated. a s272 with sites for repressors Gt and Kr removed. b Each motif in s272 ΔgtKr was replaced with a motif for Zld, preserving inter-motif sequences. The resulting enhancer drives expression across the entire length of the embryo. c. Each motif in s272 ΔgtKr was replaced with a motif for Bcd, preserving inter-motif sequences. Arrow represent the orientation of binding motifs. The resulting sequence did not drive expression. d Each motif in s272 ΔgtKr was replaced with a motif for Dst, preserving inter-motif sequences. The resulting enhancer drives expression across the middle of the embryo. The number of averaged images, n, is indicated. e The binding structure of MSE2 is shown with arrows indicating the orientation of Bcd motifs in the sequence. f The quantitative expression driven by MSE2 and MSE2 with the motif orientations indicated in panel E reversed. The resulting sequence has the same predicted affinity for Bcd, but drives less expression than MSE2