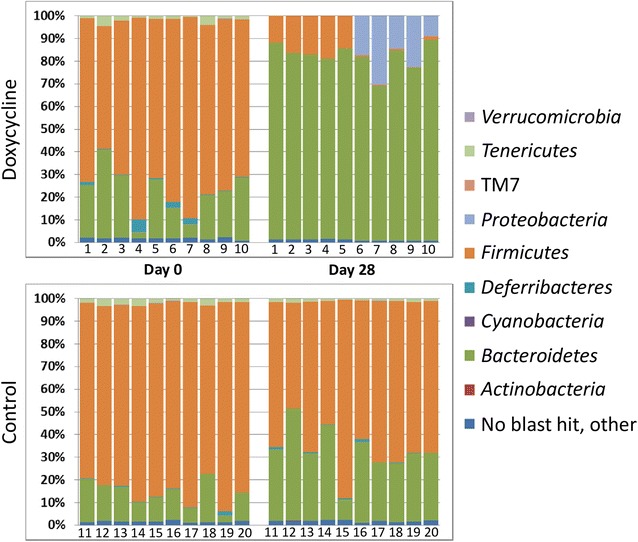
Fig. 2.

Relative abundance at taxonomic level of phylum. Bar charts showing the bacterial composition of the same control and doxycycline-treated mice on days 0 and 28 annotated to the taxonomic level of phylum. Legend of phyla is shown at right. Each bar represents an individual animal (DOX animals numbered 1–10, control animals numbered 11–20)
