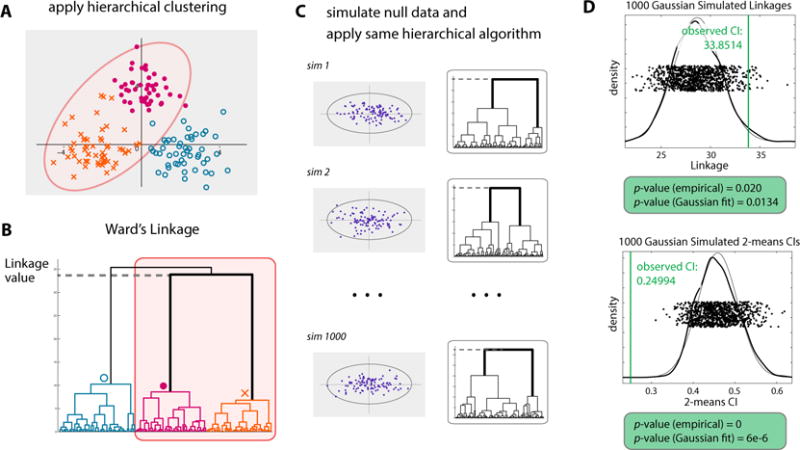
Figure 2.

The SHC testing procedure illustrated using a toy example. Testing is applied to the 96 observations joined at the second node from the root. (A) Scatterplot of the observations in ℝ2. (B) The corresponding dendrogram. (C) Hierarchical clustering applied to 1000 datasets simulated from a null Gaussian estimated from the 96 observations. (D) Distributions of null cluster indices used to calculate the empirical SHC p-values. This figure appears in color in the electronic version of this article.
