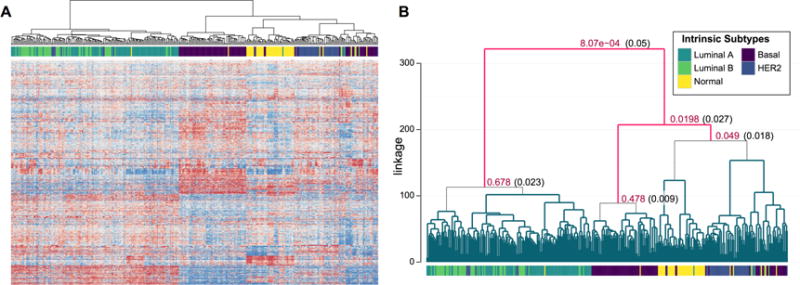
Figure 3.

Analysis of gene expression for 337 BRCA samples. (A) Heatmap of gene expression for the 337 samples (columns) clustered by Ward’s linkage. (B) Dendrogram with corresponding SHC p-values and α* cutoffs given only at nodes tested according to the FWER controlling procedure at α = 0.05. This figure appears in color in the electronic version of this article.
