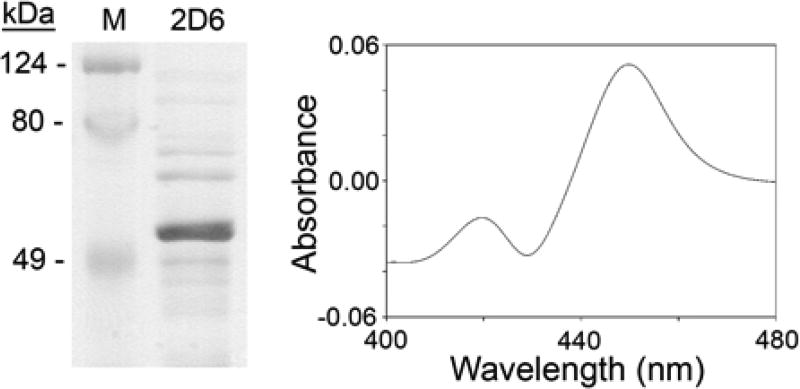
Fig. 1. Expression of human CYP2D6.
Left, Coomassie blue staining of expressed, purified CYP2D6 (prominent band at ~50 kDa). Right, spectrum of the expressed, purified protein; CYP2D6 content was determined from the carbon-monoxide difference spectrum and the molar absorption coefficient for cytochrome P450.

