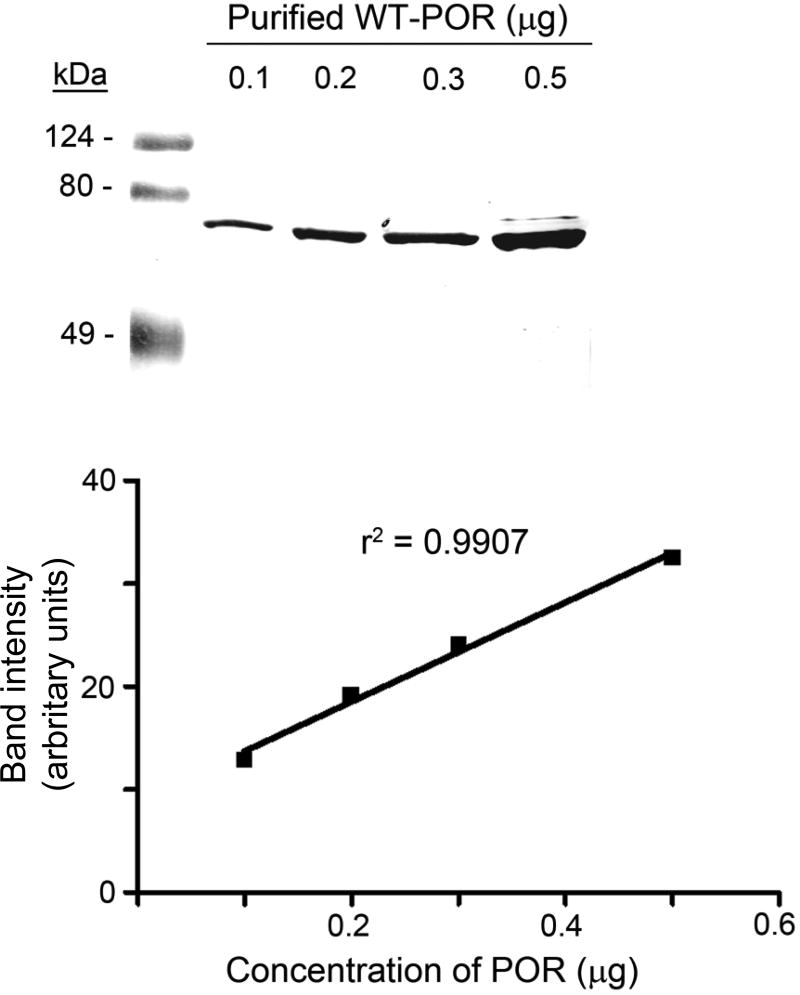
Fig. 2. Quantitation of POR proteins.
The upper panel shows a western blot of 0.1–0.5 µg of purified WT POR displayed on an SDS 10% polyacrylamide gel. The lower panel shows a standard curve plotting the known amount of WT POR protein against band intensity, in arbitrary units. POR mutants run on gels were then quantitated by comparison with this curve.

