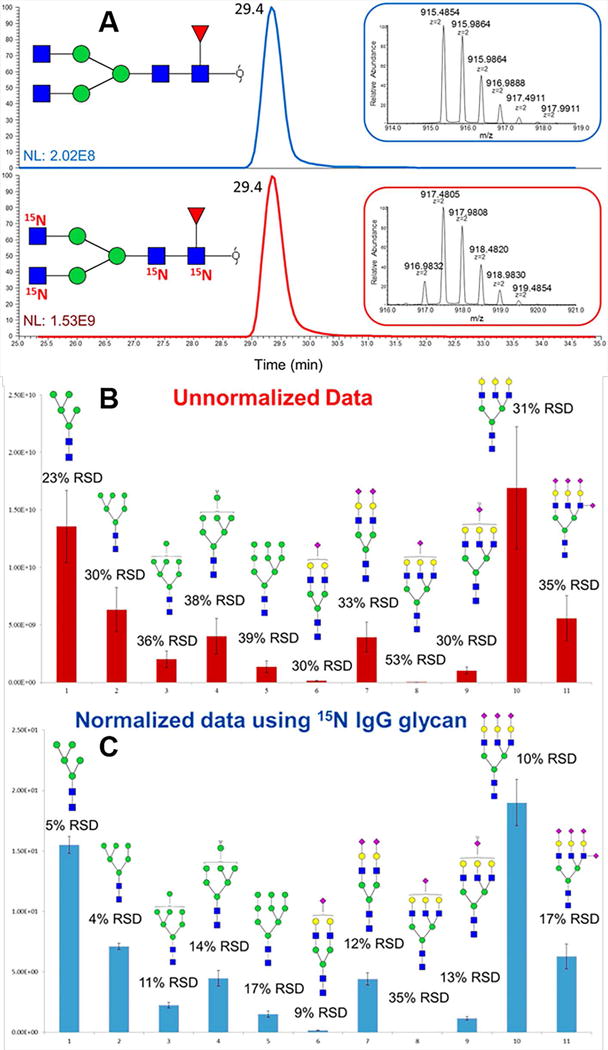
Figure 14.7.

(A) EIC and MS spectra of N-glycans released from unlabeled IgG standard and 15N iGlycoMab. Bar graphs representing intensity variation of biological (n = 3) analyses of N-glycans released from model glycoprotein mixtures (B) without normalization and (C) with normalization using 15N-glycans derived from iGlycoMab. Reprinted and modified from Zhou, S., et al., 2016, (Zhou, Tello, et al., 2016) with permission.
