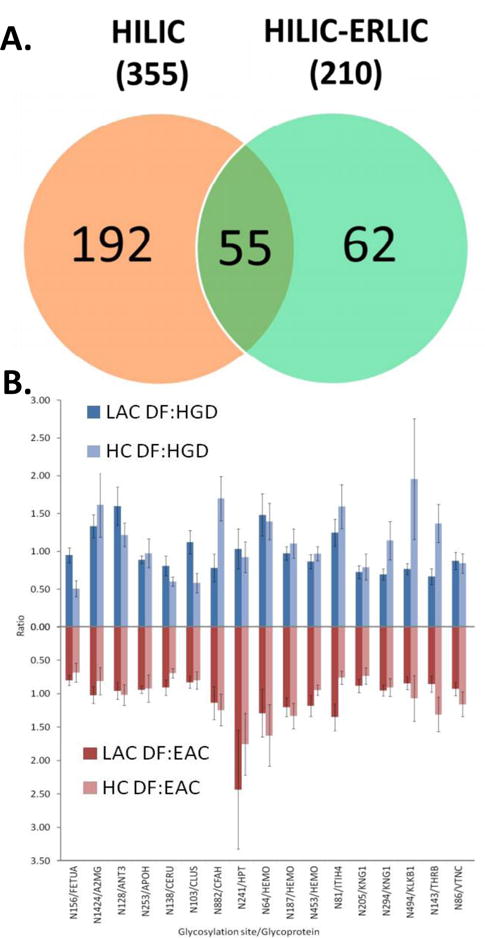
Figure 7.3. Comparison of different glycopeptide enrichment methods.

A. The Venn diagram depicts the number of identified unique glycosylation sites for HILIC and HILIC-ERLIC enrichment methods (shown bolded in the parentheses is the total number of glycopeptides identified in each case) and of those, which glycosylation sites were unique to the individual methods. Reproduced with permission (L. G. Zacharias et al., 2016). B. Comparisons of MRM quantitation for 17 common glycosylation site between lectin affinity and hydrazide chemistry enrichments in terms of ratio between different groups of biological samples. (DF: disease-free, HGD: high grade dysplasia, EAC: esophageal adenocarcinoma.) Reproduced with permission (Song et al., 2014).
