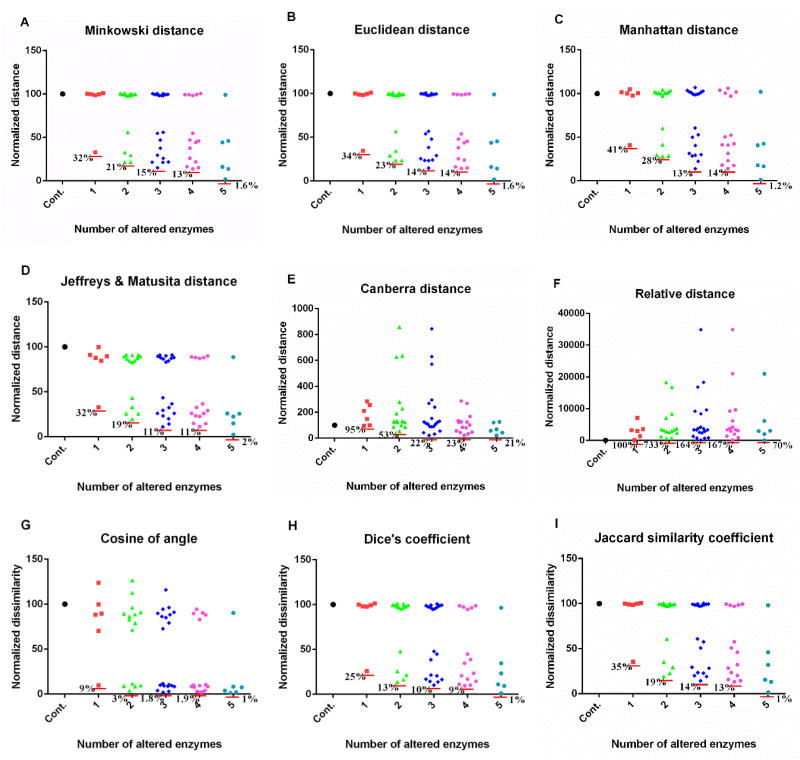
Figure 2. Performance of metrics on comparison of metabolic profiles resulted from experimentally measured enzymatic changes.
Out of six experimentally measured enzymatic changes, all possible combinations are implemented. When an exact enzymatic change is implemented, the result in each subpanel is shown in the column next to the control, which corresponds to no perturbation at all. Subsequent columns show the results of two (15 different combinations of exact perturbations), three (20 different combinations), four (15 different combinations), and five combinatory alterations of enzymatic activities (6 different combinations). The y-axis represents the distance or dissimilarity which is normalized. Results are based on relative changes. Each red horizontal line shows the smallest distance or dissimilarity in each column. A: Minkowski distance (m = 3); B: Euclidean distance; C: Manhattan distance; D: Jeffreys & Matusita distance; E: Canberra distance; F: relative distance; G: cosine of angle; H: Dice’s coefficient; I: Jaccard similarity coefficient. The corresponding plot for absolute changes is shown in Fig. S1. Note differences in magnitudes along the y-axis.

