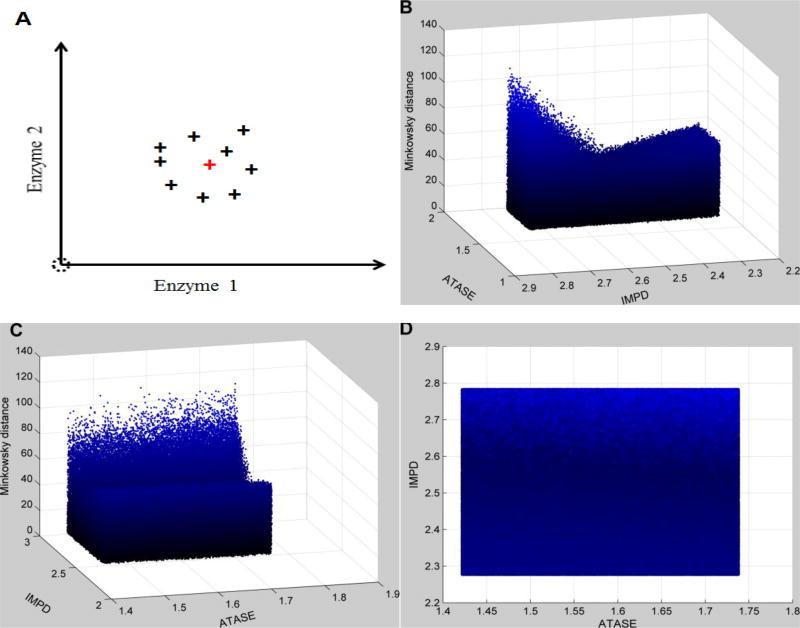
Figure 4. Distance topology for the Neighborhood surrounding the targeted enzymatic changes using relative changes.
As described in Figure 3, the enzymatic changes consist of the activation of IMPD (2.53 in fold change) and ATASE (1.58 in fold change). Uncertainty is implemented as in Figure 3. The x- and y-axes represent relative enzymatic activities of IMPD and ATASE in regard to their normal values, respectively. The z-axis shows the Minkowski distances between simulated metabolic profiles and the targeted disease profile, using relative changes instead of absolute changes. Subplot A schematically illustrates the uncertainty surrounding the targeted enzymatic changes (red cross). The same distance topology is viewed from different angles. B: horizontal rotation (−105) and vertical elevation (20); C: horizontal rotation (−15) and vertical elevation (20); D: horizontal rotation (0) and vertical elevation (20). In contrast to Figure 3, distances are unevenly distributed within the neighborhood surrounding the targeted enzymatic changes. The surface looks like a trough, which identifies IMPD as the most significant factor.

