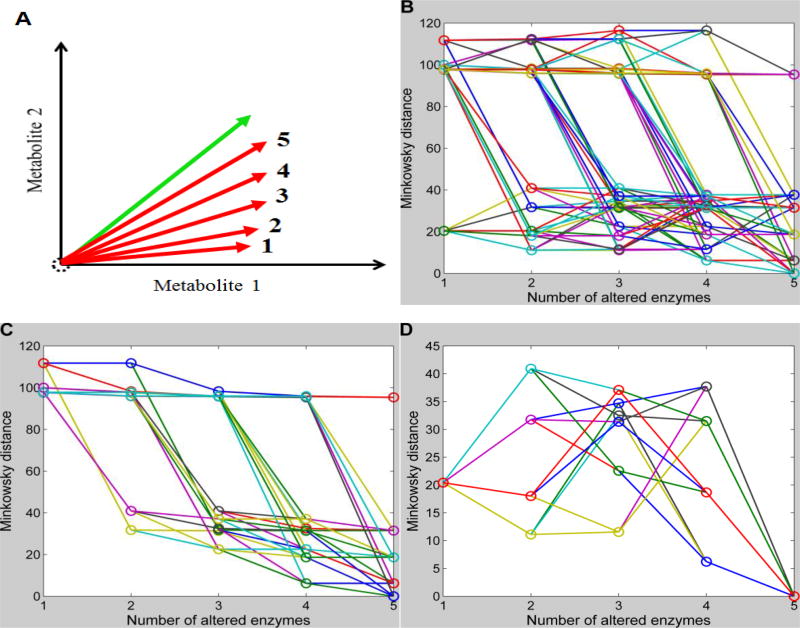
Figure 6. Feasibility of the sequential identification strategy.
Minkowski distances for all possible sequential enzymatic changes with one additional change per step are connected through lines. The x-axis shows the number of enzymatic changes in each sequential scenario, while the y-axis represents the Minkowski distances using absolute changes. With each increase in the number of enzymatic changes, the simulated vector might be expected to become closer to the target vector. A: Schematic illustration of positions of simulated vectors and the target vector for a demonstration system with only two metabolites. B: Changes in Minkowski distances with increasing numbers of sequential enzymatic changes (720 different combinations in the case of 6 enzymes). C: Out of all 720 possible sequential enzymatic changes, only those with decreasing Minkowski distances for subsequent steps are shown. D: Out of all 720 possible sequential enzymatic changes, only those are shown that start with the minimal Minkowski distance at 1st step and end with a minimum at the 5th step.

