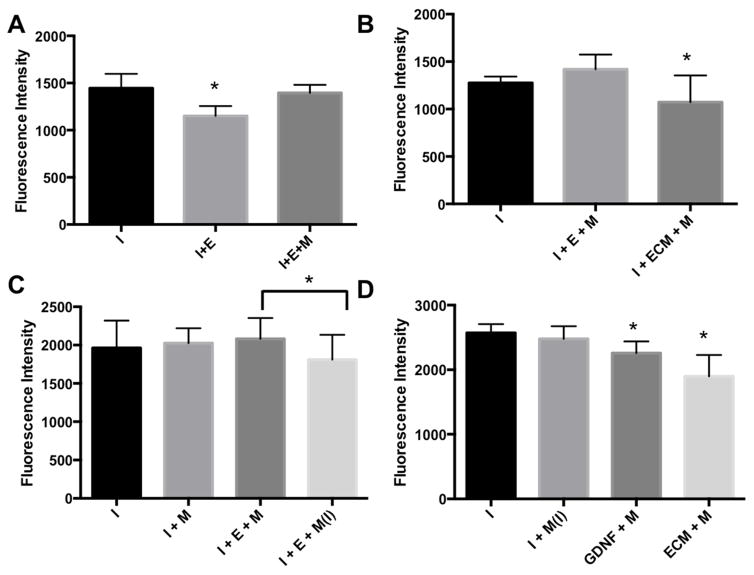
Figure 5 (A,B,C). Morphine decreases GDNF production.
A. Real-time PCR analysis of mRNA levels of GDNF in enteric epithelial cells after 30-hour morphine treatment. **p < 0.01, n=3. B. Cell lysates from control and morphine treatment (+MS) were resolved in SDS-PAGE gel and the blot was probed with antibodies against GDNF (upper panel) and b-actin (lower panel, serving as internal control for equal sample loading). C. Densitometric analysis of GDNF level in control and morphine treatment. The density of each band was determined using ImageJ (NIH). GDNF protein level was normalized to the level of b-actin in each sample. The normalized control was considered as 100%, +MS = morphine treated EGCs (mean = 71.67 +/− 7.71 (SE)). Paired Student’s t-test was performed and graph was plotted using Prizm 4.0 (Graphpad), p = 0.033, n=3, * = p<0.05.

