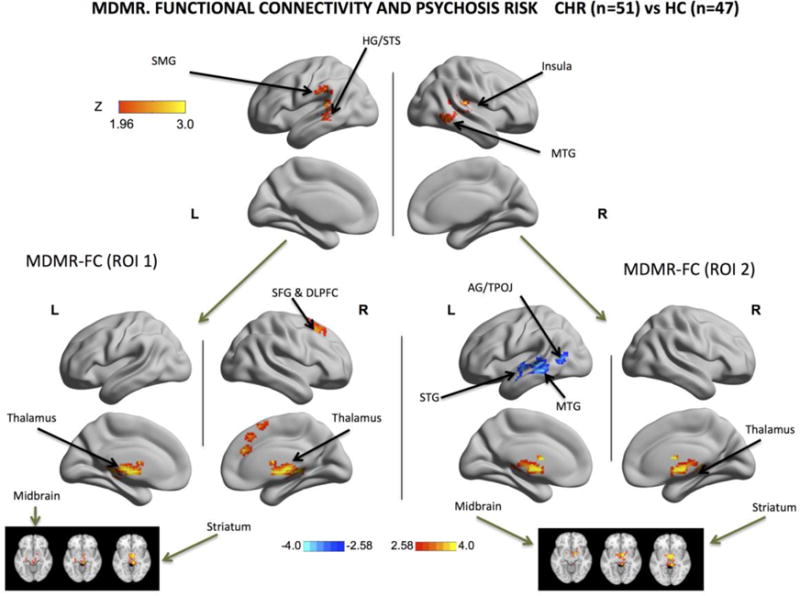
Fig.1. Intrinsic Functional Connectivity Associated with Clinical High Risk (CHR) for Psychosis. MDMR and MDMR-guided functional connectivity analyses.

Using Brainnetview, the Z scores of areas exhibiting significant MDMR-related group effects (CHR vs. HCs) were plotted on the surface map. Results for the MDMR (Multivariate Distance Matrix Regression, Upper Panel) were GRF-corrected for multiple comparisons: cluster-defining threshold Z > 1.96; corrected cluster-level threshold p < 0.05 (estimated smoothness of the statistical images in FSL Easythresh: FWHMx=9.9.mm; FWHMy=10.2mm; FWHMz=8.9 mm). MDMR-guided functional connectivity (FC) analyses were conducted using the MDMR-significant regions in the left hemisphere (Lower Left Panel) and in the right hemisphere (Lower Right Panel) with correction for multiple comparisons. MDMR univariate FC analyses, left cluster: cluster-defining threshold Z > 2.58; corrected cluster-level threshold p<0.025. The threshold of 0.025 is used to account for the number of seed ROIs, which is derived from a threshold value of p = 0.05 Bonferroni-corrected for 2 seeds (0.05/2=0.025); (estimated smoothness of the statistical images in FSL Easythresh: FWHMx= 14.9.mm; FWHMy= 15.2mm; FWHMz=13.8mm). MDMR univariate FC analyses, right cluster: cluster-defining threshold Z > 2.58; corrected cluster-level threshold p<0.025. The threshold of 0.025 is used to account for the number of seed ROIs, which is derived from a threshold value of p = 0.05 Bonferroni-corrected for 2 seeds (0.05/2=0.025);(estimated smoothness of the statistical images in FSL Easythresh: FWHMx=14.5mm; FWHMy= 13.9mm; FWHMz=13.1mm). For MDMR, the warm color indicates the presence and strength of an association between the pattern of whole-brain connections and the diagnostic group membership. For MDMR-guided functional connectivity, warm colors indicate that the CHR individuals had higher FC than controls and cold colors indicate that CHR individuals had lower FC than controls. These group comparisons show that CHR individuals have different patterns of whole-brain connectivity in the following cortical regions: left superior temporal cortex (including Heschl’s gyrus or HG), left superior temporal sulcus, left supramarginal gyrus and left middle temporal gyrus and on the right side mostly right middle temporal gyrus. Seed-based FC analyses of these regions of abnormal whole-brain connectivity in the left hemisphere (Lower Left Panel) showed increased connectivity with prefrontal regions, the cingulate cortex, the thalamus and the midbrain. Regions of abnormal brain connectivity in the right hemisphere exhibited, on the other hand, decreased connectivity with the temporal lobe and increased connectivity with the thalamus, the striatum and the midbrain (this is also shown in 3 axial slices at the bottom right and bottom left corners). HG: Heschl’s Gyrus; MTG: Middle Temporal Gyrus; SMG: Supramarginal Gyrus; STG: Superior Temporal Gyrus. STS: Superior Temporal Sulcus. ROI 1: Region Of Interest 1 identified by MDMR in the Left Hemisphere and displayed in the upper left half of the figure. ROI 2: Region Of Interest 2 identified by MDMR in the Right Hemisphere and displayed in the upper right half of the figure.
