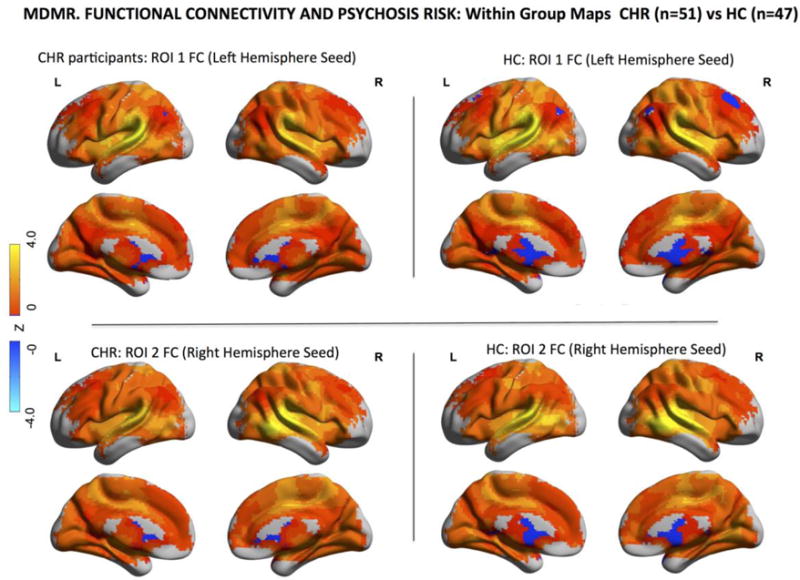
Fig. 2. Intrinsic Functional Connectivity Associated with Clinical High Risk (CHR) for Psychosis.

Within-group maps of brain-wide functional connectivity for healthy controls (HCs) and CHR participants for the two ROIs identified by MDMR and displayed in Fig.1. The comparison of these connectivity maps, here displayed separately, for CHR individuals and healthy controls yields the between-group maps displayed in the lower half of Fig. 1 also referred to as MDMR-follow up analyses. For these maps of MDMR-guided functional connectivity, warm colors indicate positive values of functional connectivity and cold colors indicate negative values of functional connectivity between the seed regions (ROI 1 and 2) and other brain areas.
