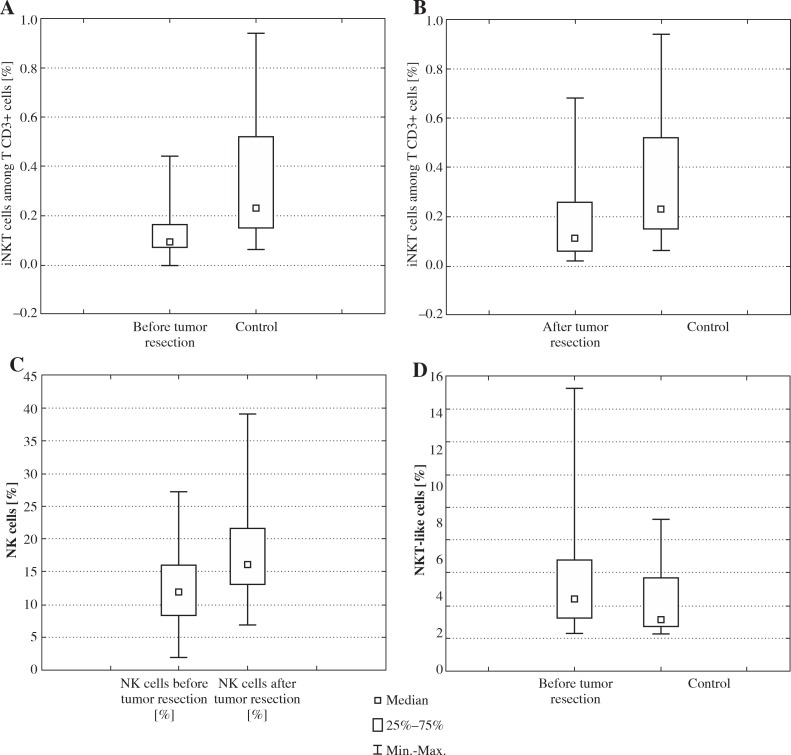
Fig. 1.
A) Percentage of iNKT cells among T CD3+ before tumor resection in comparison with control (p = 0.000395). B) Percentage of iNKT cells among T CD3+ after tumor resection in comparison with control (p = 0.01824). C) Percentage of NK cells among T CD3+ cells before tumor resection in comparison with percentage of NK cells after tumor resection (p = 0.00941). D) Percentage of NKT-like cells before tumor resection in comparison with control (p = 0.0346)

