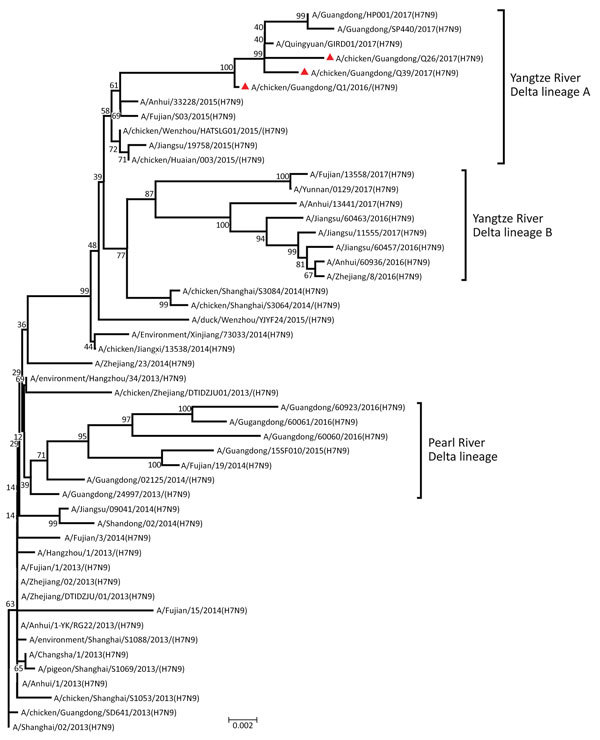
Figure.

Phylogenetic analysis of the hemagglutinin gene of 3 isolates (triangles) of avian influenza (H7N9) virus obtained from chickens in southern China, 2016–2017, compared with reference isolates. The tree was constructed by using the neighbor-joining method with the maximum composite likelihood model in MEGA version 5.2 (http://www.megasoftware.net) with 1,000 bootstrap replicates, based on the nucleotide sequence 1–1,695. Virus lineages are shown at right. Scale bar indicates nucleotide substitutions per site.
