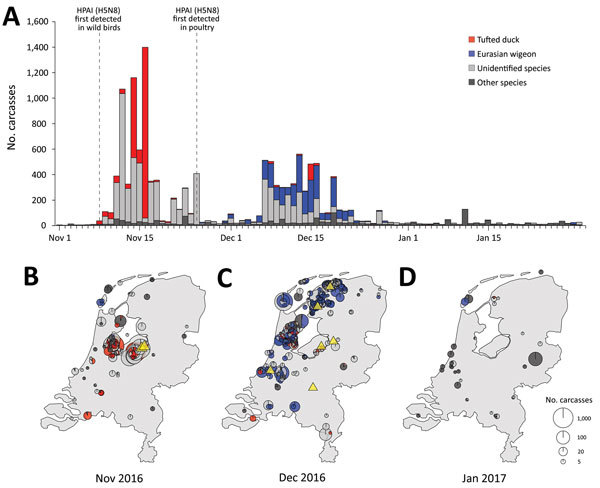
Figure 1.

Spatiotemporal pattern of wild bird deaths during an outbreak of HPAI A(H5H8) virus, the Netherlands, November 2016–January 2017. A) Outbreak chronology in tufted duck (red); Eurasian wigeon (blue); unidentified carcasses (light gray), probably also mostly tufted duck and Eurasian wigeon; and all other species combined (dark gray). Dashed vertical lines depict the first detections in wild birds and in poultry in the Netherlands. B–D) Spatial overview of the reported cumulative number of deaths in November 2016 (B), December 2016 (C), and January 2017 (D). Each point on the maps is a pie chart giving the proportions of the respective species (groups) at that location and their size is scaled to the log10 of the number of reported carcasses. Yellow triangles mark the locations of outbreaks in commercial poultry holdings. Only locations where >3 dead birds were reported are shown. HPAI, highly pathogenic avian influenza.
