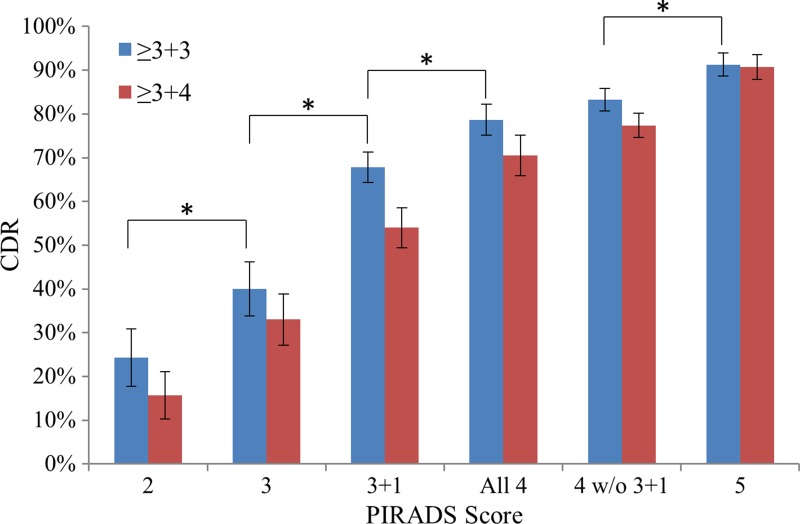
Figure 3:
Graph shows probability of cancer detection with standard error for each PI-RADS version 2 score. Each score showed an added benefit over the previous score (P < .05). DW imaging lesions with a PI-RADS score of 3 and DCE-positive lesions in the PZ (Gleason 3 + 1) represent a distinct risk population from all other PI-RADS category 4 or 3 lesions. * = P < .05. CDR = cancer detection rate.

