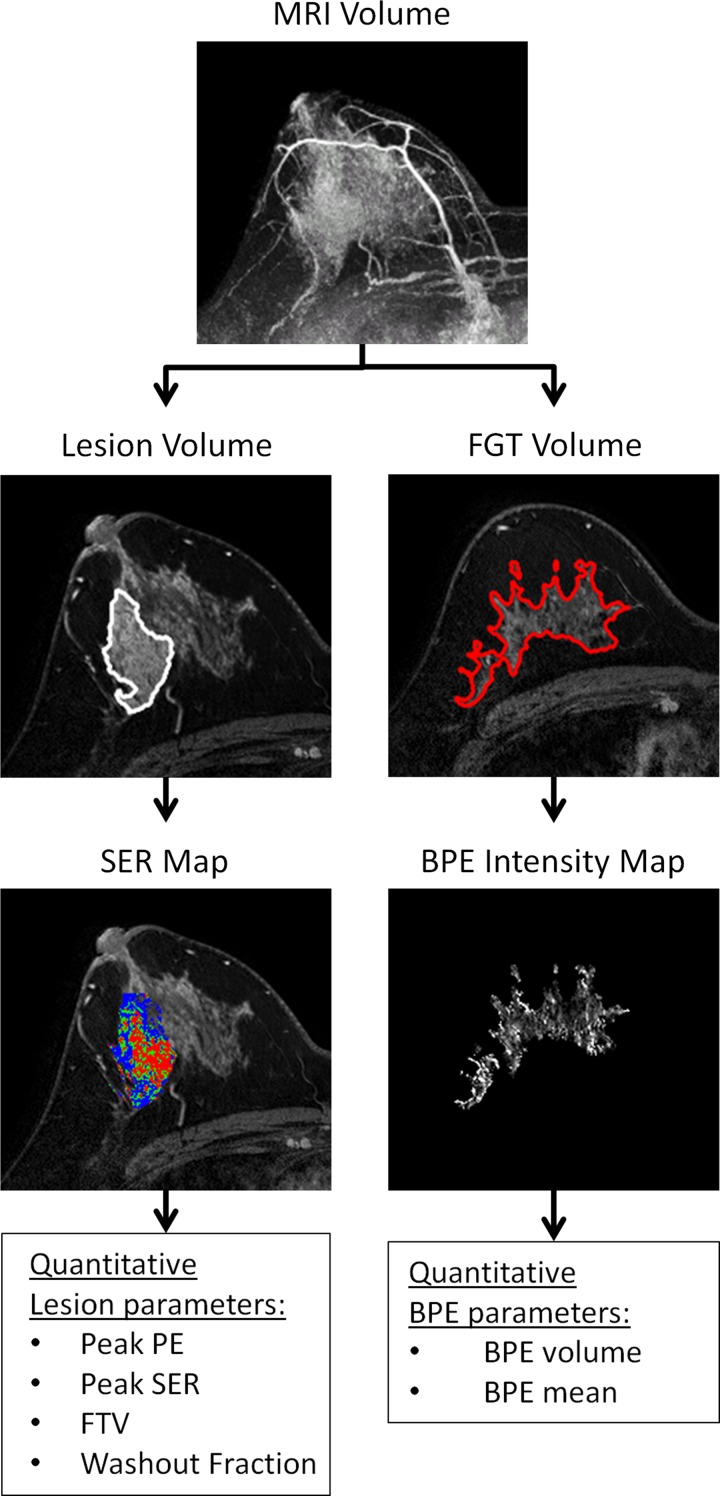
Figure 1:
Quantitative postprocessing pipeline for lesion and normal tissue parameters at DCE MR imaging in a 38-year-old woman with biopsy-proven DCIS. Representative images from each step of the pipeline are shown. Three-dimensional tumor extent is specified by manually drawn regions of interest on two orthogonal maximum intensity projection images (MRI Volume). Custom software uses a PE threshold greater than 50% to automatically segment the tumor (Lesion Volume). The software calculates PE on a voxel-by-voxel basis within the tumor and calculates whole lesion parameters (peak PE, peak SER, functional tumor volume [FTV], and washout fraction). The SER map is depicted as a color overlay: blue indicates persistent enhancement (SER <0.9); green, plateau enhancement (SER, 0.9–1.1); and red, washout (SER >1.1). To quantify normal tissue features, a signal intensity threshold is applied to the initial MR volume to segment the fibroglandular tissue (FGT ) volume, and it can be manually refined on each MR section to exclude adipose tissue, lesion, and blood vessels. A BPE intensity map is then generated by excluding voxels with PE less than 10%, and quantitative BPE parameters are calculated (BPE volume and BPE mean).

