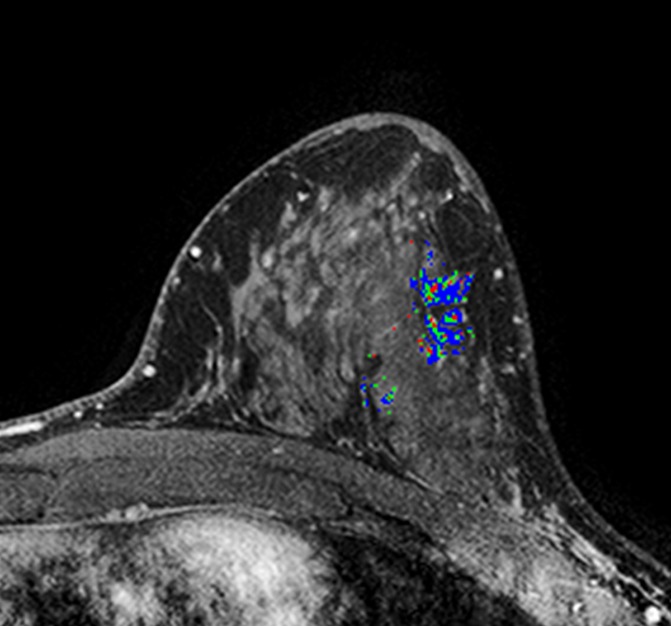
Figure 3d:

MR images in (a, b) a 41-year-old woman with recurrence after definitive surgical treatment for DCIS and (c, d) the matched 45-year-old control subject. (a) Subtracted maximum intensity projection shows marked BPE, which was quantitatively measured as mean BPE of 86%. The BPE measurement excludes the known DCIS lesion in the ipsilateral breast (arrow). (b) SER map with color overlay shows a peak SER of 1.57 and an FTV of 8.69 cm3 were calculated from kinetics data. Blue indicates persistent delayed enhancement (SER <0.9); green, plateau enhancement (SER, 0.9–1.1); and red, washout (SER >1.1). (c) Subtracted maximum intensity projection for the matched control subject shows minimal BPE (arrow), which was quantitatively measured as mean BPE of 71%. (d) SER map with color overlay shows a peak SER of 1.17 and an FTV of 1.27 cm3 were calculated from kinetics data.
