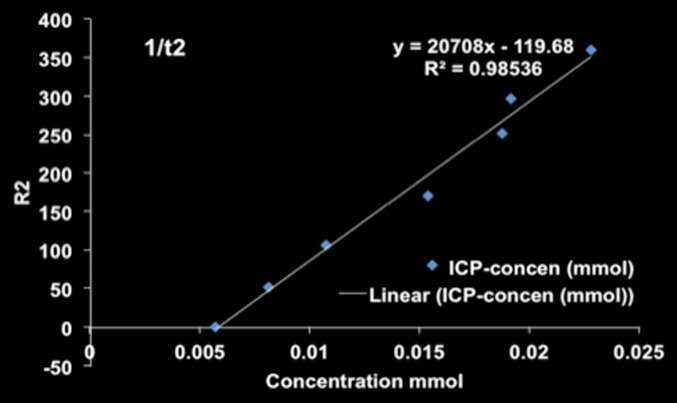
Figure 3a:
R2 and R2* imaging and quantification. Wistar rats inoculated with CC-531 cells and tumors (arrow, c, d) were allowed to grow for 7–10 days. R2 and R2* images of rats were obtained with a 7.0-T MR imager at baseline and immediately after and at 24 hours after infusion. Voxel-wise R2 and R2* measurements were performed, and color map overlays were created. Plots show measurements of (a) R2 and (b) R2* and their correlation with HNP concentrations. (c) Coronal R2* baseline MR image (unit, one per second). (d) Coronal MR image shows R2* 24 hours after infusion of HNP (unit, one per second). Signal intensity loss is noted both in liver and in tumor between the time points. (e) Image of rat taken with a thermal camera during PTA while temperature measurements were being taken. ICP concen = inductively coupled plasma concentration.

