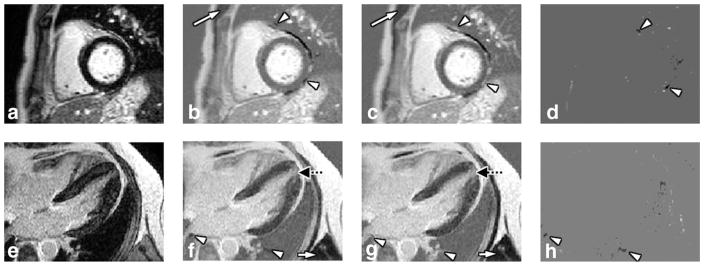
FIG. 5.
Magnitude, RAPID and PSIR reconstructed cardiac images. In the top row (a–d) patient 1 is shown, in the bottom row (e–h) data from patient 2 is presented. The different columns represent magnitude (a,e), RAPID (b,f), PSIR (c,g) reconstructed and difference (d,h) images, respectively. Good agreements were found for both cases. Tissues with long T1 like muscle (white arrows) and pericardial fluid were properly identified and inverted by the RAPID algorithm. A suspected apical infarction is also identified by both reconstruction algorithms (dotted black arrows on (f,g)) on patient 2. To facilitate the comparison, locations of the differences were labeled using arrow-heads (b–d,f–h), which were mainly found in tissues isolated by air occupied regions in the lung or impacted by the increased local field inhomogeneity next to the lung.

