
Figure 2.
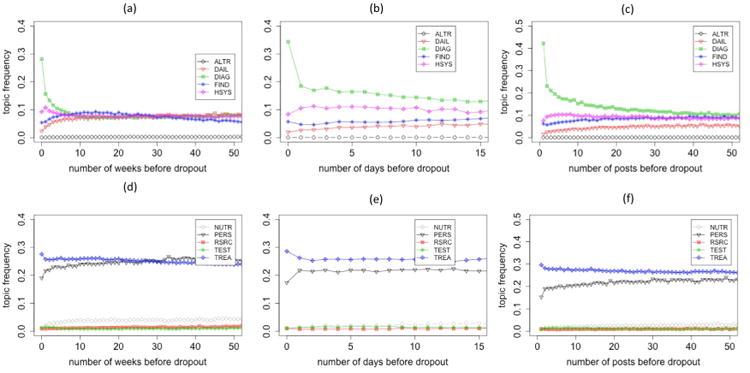
How topic frequencies change through time after members join the community. X axes represents the time point after members' first activity. Y axis is the average topic frequency of all posts that are published in the corresponding time. Units of x axes in (a)(d), (b)(e), and (c)(f) are weeks, days, and post orders, respectively.