. 2017 Jun 8;9(30):10662–10673. doi: 10.1039/c7nr02524f

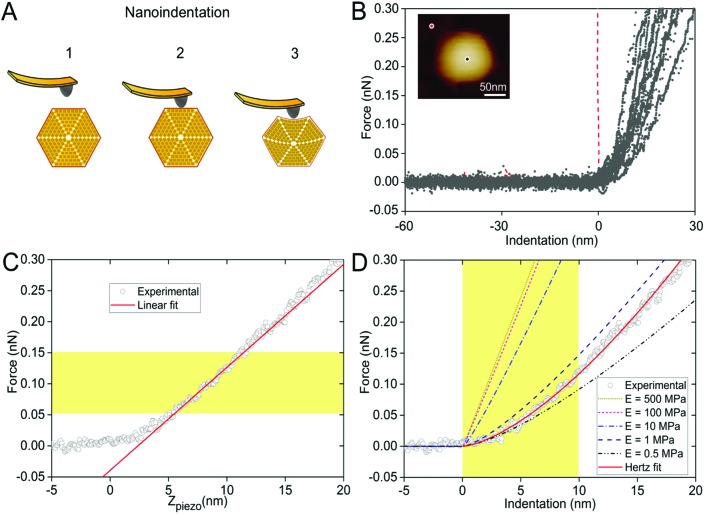
Fig. 6. Mechanical characterization of intact β-carboxysomes using AFM nanoindentation. (A) Schematic of an AFM nanoindentation experiment, including AFM tip engagement (1), tip-carboxysome contact (2) and indentation (3) with increasing force. (B) Force-indentation curves of individual β-carboxysomes. The red curve is the reference curve on the mica substrate. Inset, AFM image of a single β-carboxysome during AFM nanoindentation. The black dot represents the indentation position on the carboxysome, whereas the red dot represents the indentation position on mica surface. (C) A typical force-displacement curve of a single β-carboxysome. The red line is the fitting using the linear model based on the 0.05–0.15 nN region of the force curve. (D) A typical experimental (circle) force-indentation curve of a single β-carboxysome and simulated force-indentation curves (colored dash lines) using a Hertz contact model in a sample with Young's modulus ranging from 0.5 to 500 MPa. The red curve is the fitting using the Hertzian model based on the 0–10 nm region of the force curve. Young's modulus of β-carboxysomes (EH) is 0.59 ± 0.34 MPa (n = 25), sitting between the predicted Young's moduli of 0.5 and 1 MPa.

Fig. 6