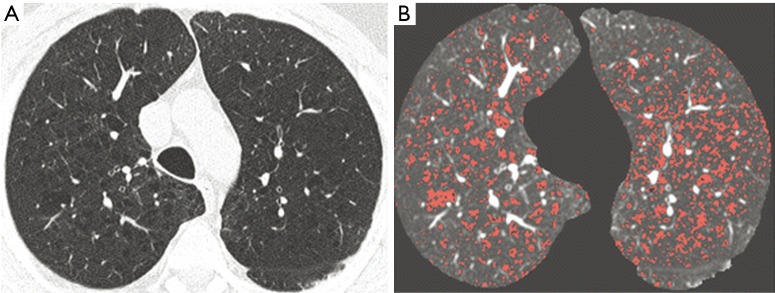
Figure 2.
Low-dose CT image at aortic arch (A) in one subject undergoing lung cancer screening showing multiple areas of decreased attenuation bilaterally. In (B) the pixels with density values below −950 HU (RA950) are outlined in red. Adapted and reproduced with permission from reference (56). CT, computed tomography.

