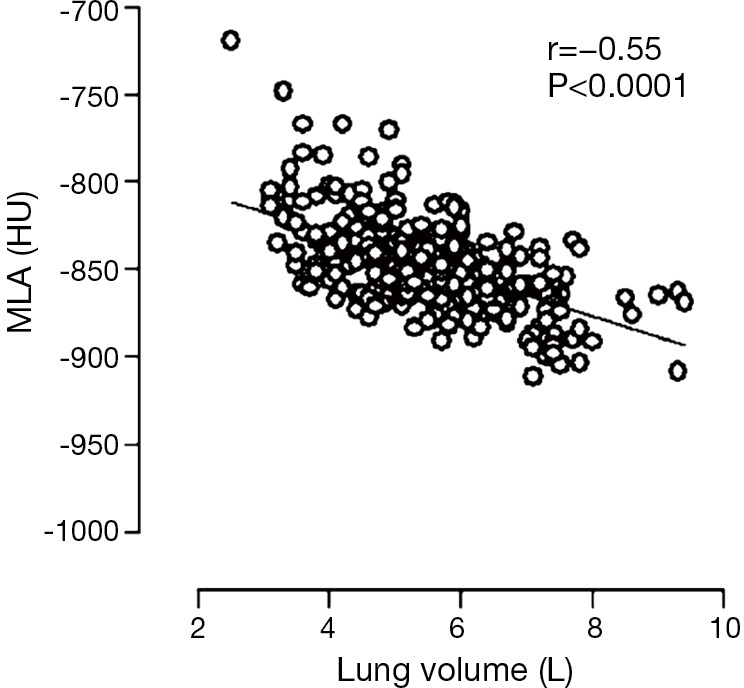
Figure 4.

Correlation plot between lung volume and average MLA in 266 smokers or former smokers examined with low-dose CT shows dependency of lung density from lung volume. Adapted and reproduced with permission from reference (56). HU, Hounsfield units; MLA, mean lung attenuation; CT, computed tomography
