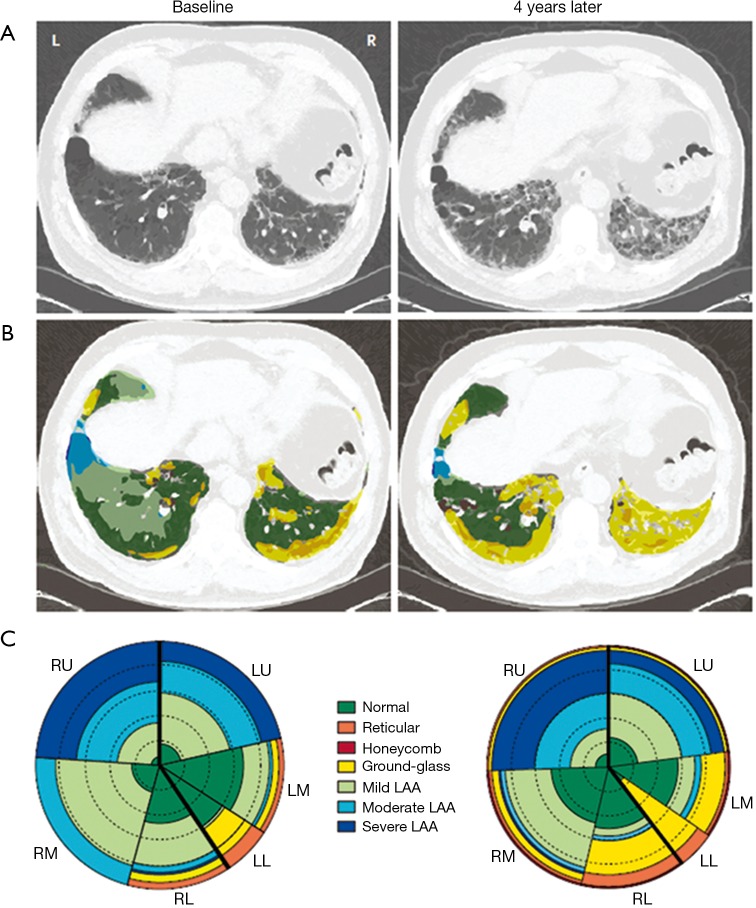
Figure 6.
Local histogram-based (CALIPER) analysis of progressive lung fibrosis at baseline and 4 years later. (A) CT sections through the lower lungs show progression (left to right image) of the lung fibrosis; (B) CALIPER analysis with color coding according to CT pattern shows increase in extent of patterns characterized as ground glass abnormality (yellow) and a reduction in the extents of LAA (blue) and normal lung (green); (C) glyph-based analysis summarizes the extent of each pattern of abnormality in each lobe (the same color coding as in part B). The left lower lobe has decreased in volume. A relative increase is shown in extent of fibrotic abnormality (mainly yellow, orange, and red) and a decrease in normal lung (green) during 4 years (left glyph-based analysis to right). Reproduced with permission from reference (6). RU, right upper; LU, left upper; LM, left middle; RM, right middle; LL, left lower; RL, right lower; LAA, low attenuation areas.

