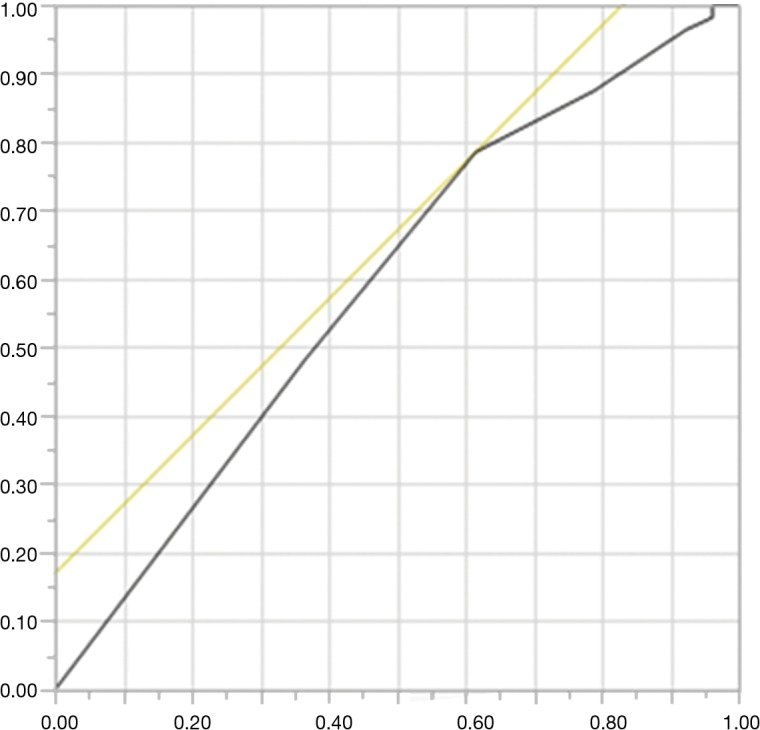
Figure S1.

A ROC curve for the CONUT. The continuous variables CONUT and OS were used as the test and state variables, respectively. The optimal CONUT cut-off value was found to be 2, with an area under curve, sensitivity, and specificity being 0.58997, 0.7857, and 0.3846, respectively. CONUT, controlling nutrition status; ROC, receiver operating characteristic; OS, overall survival.
