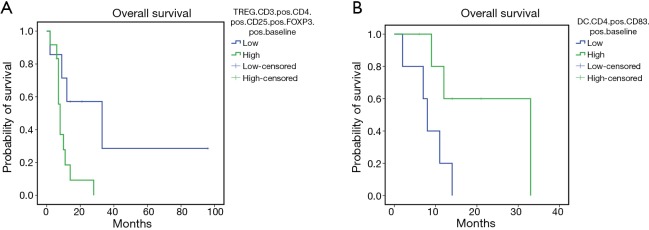
Figure 4.
Kaplan-Meier survival curves for patients with lower (L) or higher (H) baseline levels of peripheral regulatory T cells (Tregs) (A) and patients with L or H baseline levels of activated CD83+DC (B). Our analysis showed that the patients with L baseline levels of peripheral regulatory T cells (Tregs) have a longer survival than patients with H baseline levels of Tregs [mean OS L vs. H: 40.14 months (95% CI: 7.57–72.7) vs. 9.9 months (95% CI: 5.9–13.9), P=0.02]. Moreover, patients with H baseline levels of activated CD83+DC have a longer survival than patients with low baseline levels of activated CD83+DC [mean OS L vs. H: 8.4 months (95% CI: 4.45–12.34) vs. 24.0 months (95% CI: 12.12–35.88), P=0.03]. OS, overall survival.

