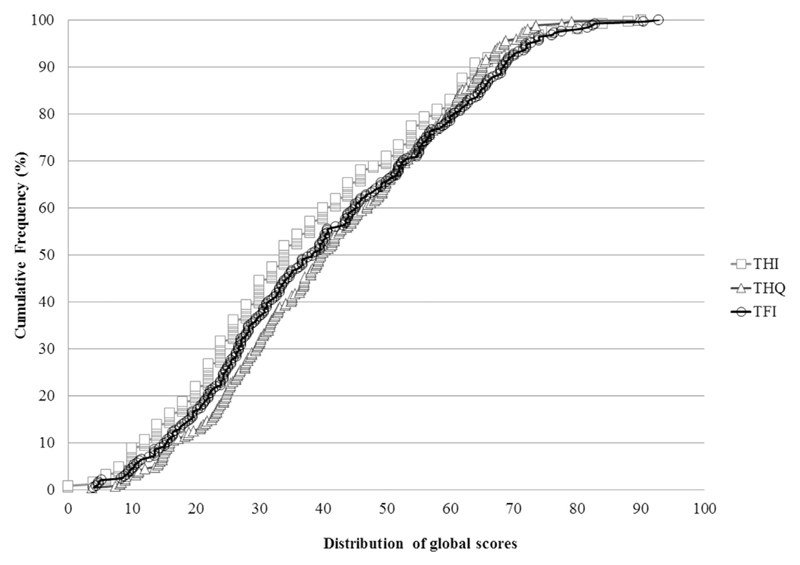
Fig. 2.
Cumulative frequency distributions of Tinnitus Functional Index (TFI), Tinnitus Handicap Inventory (THI), and Tinnitus Handicap Questionnaire (THQ) global scores. The percentage of responses for 247 participants on the three different tinnitus questionnaires completed. The graph indicates that the TFI global scores are evenly distributed across the scale, i.e. 100% of participants scored below 90, whilst the THI and THQ global scores distributed towards the lower end, i.e. 70% of participants scored below 50 on the THI and all participants scored less than 70 on the THQ.

