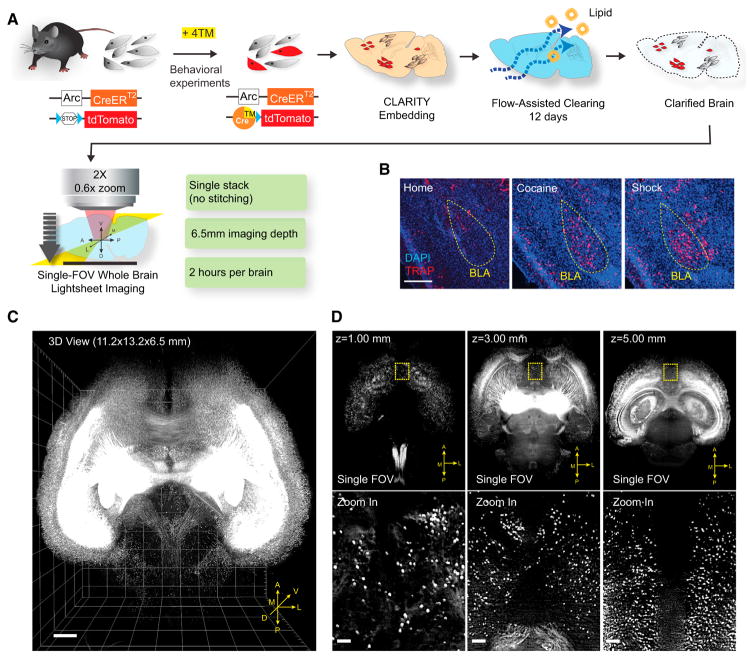
Figure 1. Behavioral Cohort-Scale Brain-wide Activity Mapping.
(A) Schematic of ArcTRAP labeling and the enhanced cohort-scale CLARITY pipeline for rapid whole-brain clearing and imaging. CreER expression is driven by the activity-dependent Arc promoter to mediate 4TM-dependent recombination that permanently labels the active neurons with tdTomato.
(B) Representative confocal images from 40-μm sections showing TRAP labeling in BLA (yellow circle). Scale bar, 400 μm.
(C) 3D rendering of a CLARITY-processed whole-mouse brain (ArcTRAP) imaged by light-sheet microscopy. Scale bar, 500 μm.
(D) Top: single field of view (FOV) images at the indicated imaging depths. Bottom: zoomed-in images from the yellow-boxed regions in the top row showing cellular resolution. Scale bar, 100 μm.
See also Figure S1.

