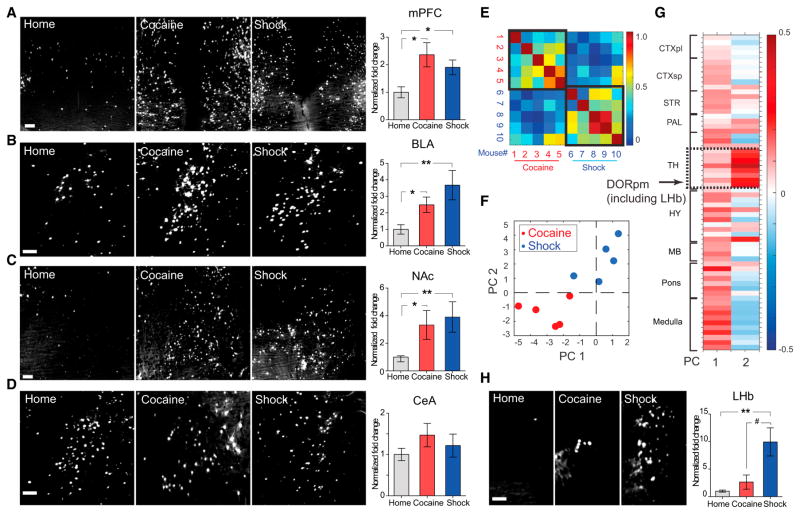
Figure 2. Cocaine and Shock Recruit Overlapping Brain Regions.
(A–D) TRAP cells in manually annotated regions. Left: representative images taken at the center of the indicated regions (max-projection of 100 μm volume). Scale bars, 100 μm. Right: fold change in TRAP cell numbers (normalized to home cage).
(E) Pearson correlation among the ten mice, based on the r-value computed from fold-activation changes relative to home cage across all non-zero-containing brain regions. Note the higher brain-wide correlation values within behavioral groups (black bounding boxes) compared to across-groups.
(F) Locations of individual mice projected into the 2D space of the two principal components (PCs) comprising the majority of the variance (in arbitrary PC units), where the position of each mouse corresponds to the extent to which a particular principal component accounts for that mouse’s variance across all brain regions.
(G) Principal component coefficients (in arbitrary PC weight units) across brain areas—the contribution of each brain area to each principal component—were summarized as clusters of proximal regions. Note the distinct region-selective contribution to PC 2 (dashed box; detailed in text). CTXpl/sp, cortical plate/subplate; SRT, striatum; PAL, pallidum; TH, thalamus; HY, hypothalamus; MB, midbrain; DORpm, polymodal association cortex-related dorsal thalamus.
(H) Representative image and quantification of TRAP cells in LHb. Scale bar, 100 μm. For all panels, n = 5 per group, *p < 0.05, **p < 0.01, unpaired t test comparing behavioral group to home cage; # p < 0.05, unpaired t test comparing cocaine versus shock group. All p values were adjusted for multiple comparisons using the false discovery rate method. Error bars, mean ±SEM.

