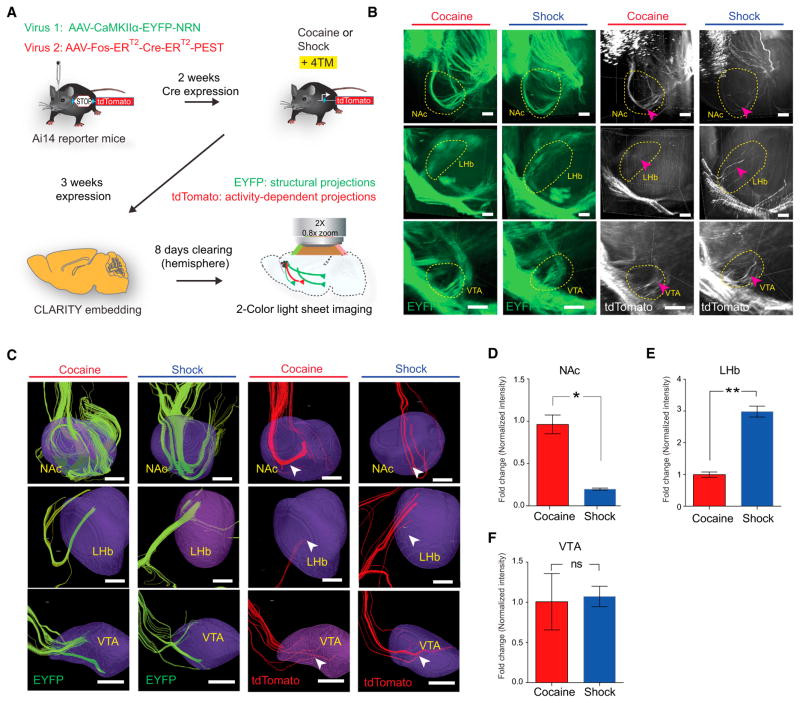
Figure 4. Distinct Projection Targets of Cocaine and Shock-Activated mPFC Populations.
(A) Summary of CAPTURE workflow (described in text).
(B) Representative CLARITY images of the structural projections (green, EYFP) and activity-dependent projections (white, tdTomato) from cocaine- and shock-labeled mice in NAc (top), LHb (middle), and VTA (bottom). Arrowheads indicate axon bundles terminating in the circled region. Scale bar, 200 μm.
(C) Reconstructed streamlines from(B), showing streamlines terminating in the 3D brain regions (purple). Green streamlines, reconstructed from EYFP fibers; red streamlines, reconstructed from tdTomato fibers. Scale bars, 200 μm.
(D–F) Quantification of projection intensity from cocaine- and shock-activated mPFC populations in three regions. Behavior-specific projection intensity was quantified using the ratio between red and green fibers (i.e., the number of red streamlines, divided by the number of green streamlines) terminating in indicated regions and plotted as fold change (relative to the cocaine group, n = 6 per group; ns, p > 0.05, *p < 0.05, **p < 0.01, unpaired t test). Error bars, mean ±SEM.
See also Figure S4.

