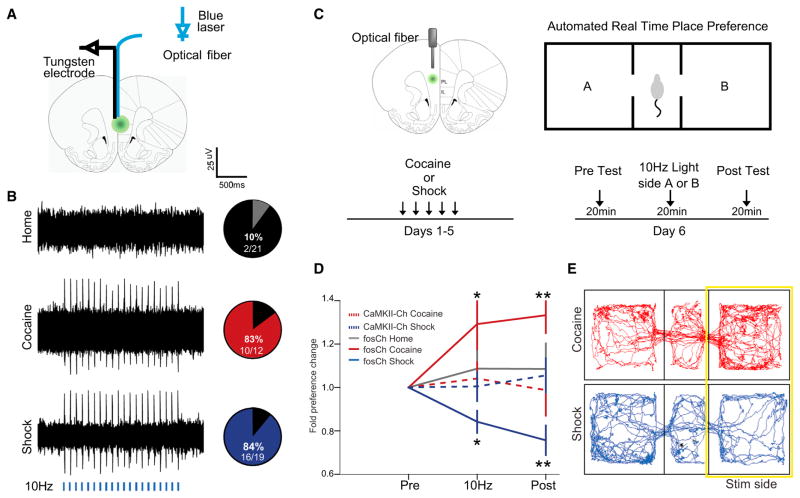
Figure 7. Differential Behavioral Influence of Cocaine- and Shock-Activated mPFC Populations.
(A) Schematic to illustrate the placement of the recording electrode and optical fiber for in vivo recording. The optrode was lowered in 100 μm steps along the dorsal-ventral axis of mPFC.
(B) Left: representative extracellular recordings showing neural response to a 10 Hz light train (5 ms pulses for 2 s, every 5 s, 5 mW 473 nm light, indicated by blue bars). Right: pie charts indicate percentage of recording sites showing light-evoked action potential firing for the home cage (gray), cocaine (red), and shock (blue) groups.
(C) Schematic shows the location of the optical fiber positioned above the injection site in green. After 5 days of training, mice were tested by a real time place preference test, which consisted of three consecutive 20-min trials.
(D) Behavioral results plotted as fold change in preference for the light stimulated side (normalized by baseline preference) across each of the trials. n = 10–14 per group, *p < 0.05, **p < 0.01, ANOVA, followed by Tukey’s multiple comparison test. Error bars, mean ±SEM.
(E) Movement tracking data from representative cocaine- and shock-labeled animals during the light-stimulation trial.
See also Figure S7.

