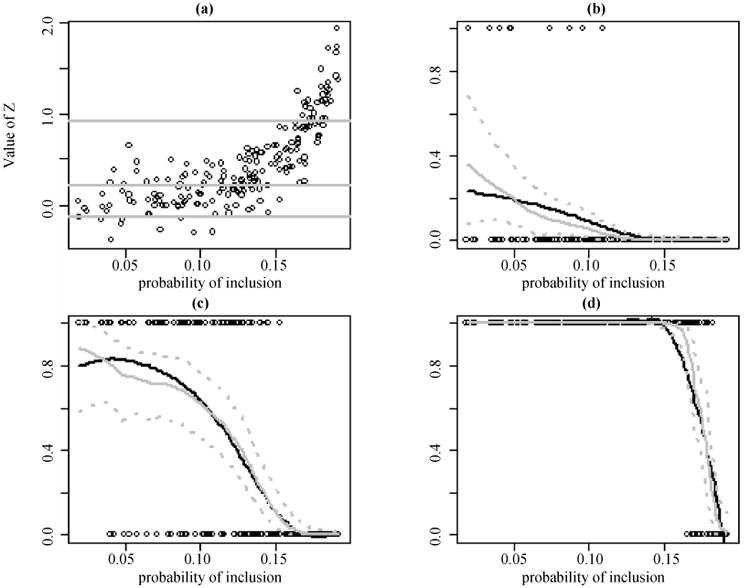
Figure 2.

A random pps sample from the EXP case (n = 200, N = 2,000): (a) scatter plot of Z; the three grey lines are the superpopulation 10th, 50th, and 90th percentiles, respectively. (b) black circles are observed units of binary survey variable Y in the sample, defined as Y = I (Z ≤ 10th percentile); the grey solid and dashed curves are posterior means of Pr (Yi = 1|πi) and 95% credible intervals, respectively, simulated based on a probit p-spline model on π; and the black curve is the superpopulation Pr(Yi = 1|πi). (c) similar to (b), but with Y = I (Z ≤ 50th percentile). (d) similar to (b), but with Y = I (Z ≤ 90th percentile)
