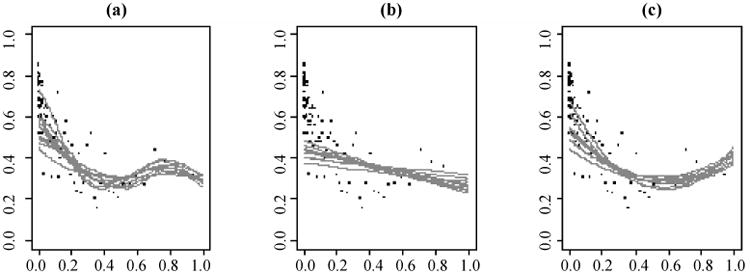
Figure 5.

Predictions based on the combined data of pps samples and the observations sampled with certainty in the tax auditing example, X-axis: inclusion probabilities π, Y-axis: P(Y = 1|π); black dots are the true P(Y = 1|π) within each percentile of π; grey curves are ten realizations of the posterior mean of P(Y = 1|π). The prediction models are (a) probit linear p-spline regression, (b) linear probit regression, (c) quadratic probit regression
