
Figure 3.
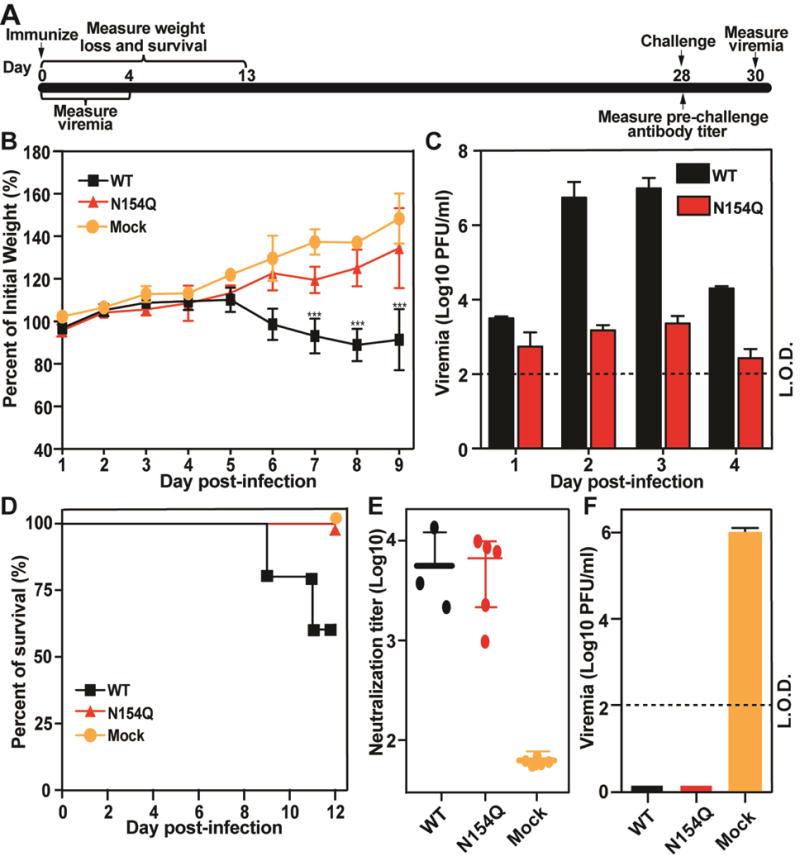
Comparison of virulence between WT and N154Q in the A129 mice. Three-week old mice (5 mice per group) were infected with 104 PFU of WT or N154Q virus or PBS via subcutaneous injection. (A) Scheme of vaccination and challenge. (B) Mouse weight loss after infection with WT or N154Q virus. Mock or infected mice (n = 5 per group) were monitored for weight loss over the course of 9 days post-infection. A two-way ANOVA test was performed to evaluate the statistical significance of weight differences among WT and N154Q infected mice with mock group at each point. Error bar represent standard deviation. Symbols *** indicate P values <0.001. (C) Mouse viremia after infection with WT and N154Q viruses. Viremia were quantified using plaque assay. The limit of detection (L.O.D.) for viremia is 100 PFU/ml. (D) Mortality for WT, N154Q and mock group. (E) Pre-challenge neutralization antibody titers. On day 28 p.i., mouse sera were measured for antibody neutralizing titers using a mCherry ZIKV infection assay. The expression of mCherry in infected Vero cells was analyzed by a fluorescent microscopy at 28 days post-infection. (F) Post-challenge viremia. On day 28 post-infection, mice were challenged with 1×10⁵ PFU parental virus (ZIKV strain FSS13025) via the I.P. route. Viremia on day 2 post-challenge was quantified using plaque assay. Error bar represent standard deviation.