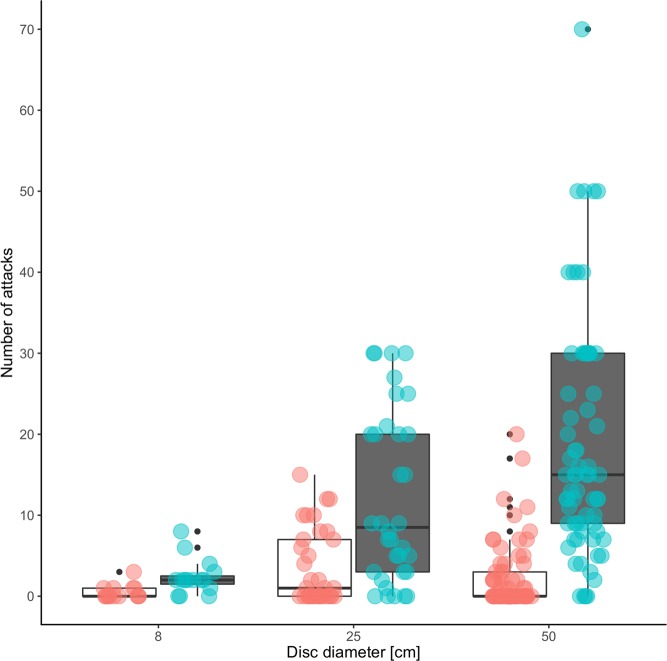
Fig 3. Number of attacking bees in response to up and downwards movement in three different disc sizes (8 cm, 25 cm, 50 cm).
Discs were displayed in a 1.5 m distance to the nests. Box plots in white with red scatter plot overlay represent number of attacking bees during downward movement of discs. Box plots in grey with cyan scatter plot overlay represent number of attacking bees during upward movement of discs respectively. The total number of observations were 15 for 8 cm (colony 1 only), 34 for 25 cm (colonies 1 and 3) and 70 for 50 cm (colonies 1, 2, 4 and 5) disc sizes respectively.

