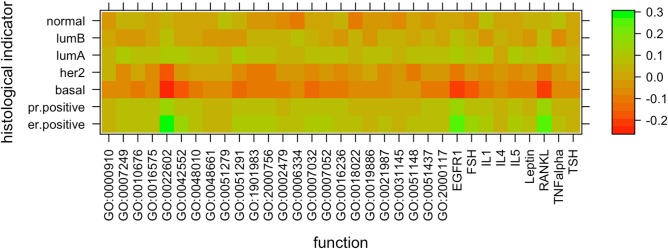
Fig 3. Diffusion based functional heterogeneity across clinical subtypes.
The following figure displays the log ratio between the average numbers of genes assigned to each function by diffusion (represented by columns) across samples annotated with a subtype (represented by rows) versus the rest of the samples.

