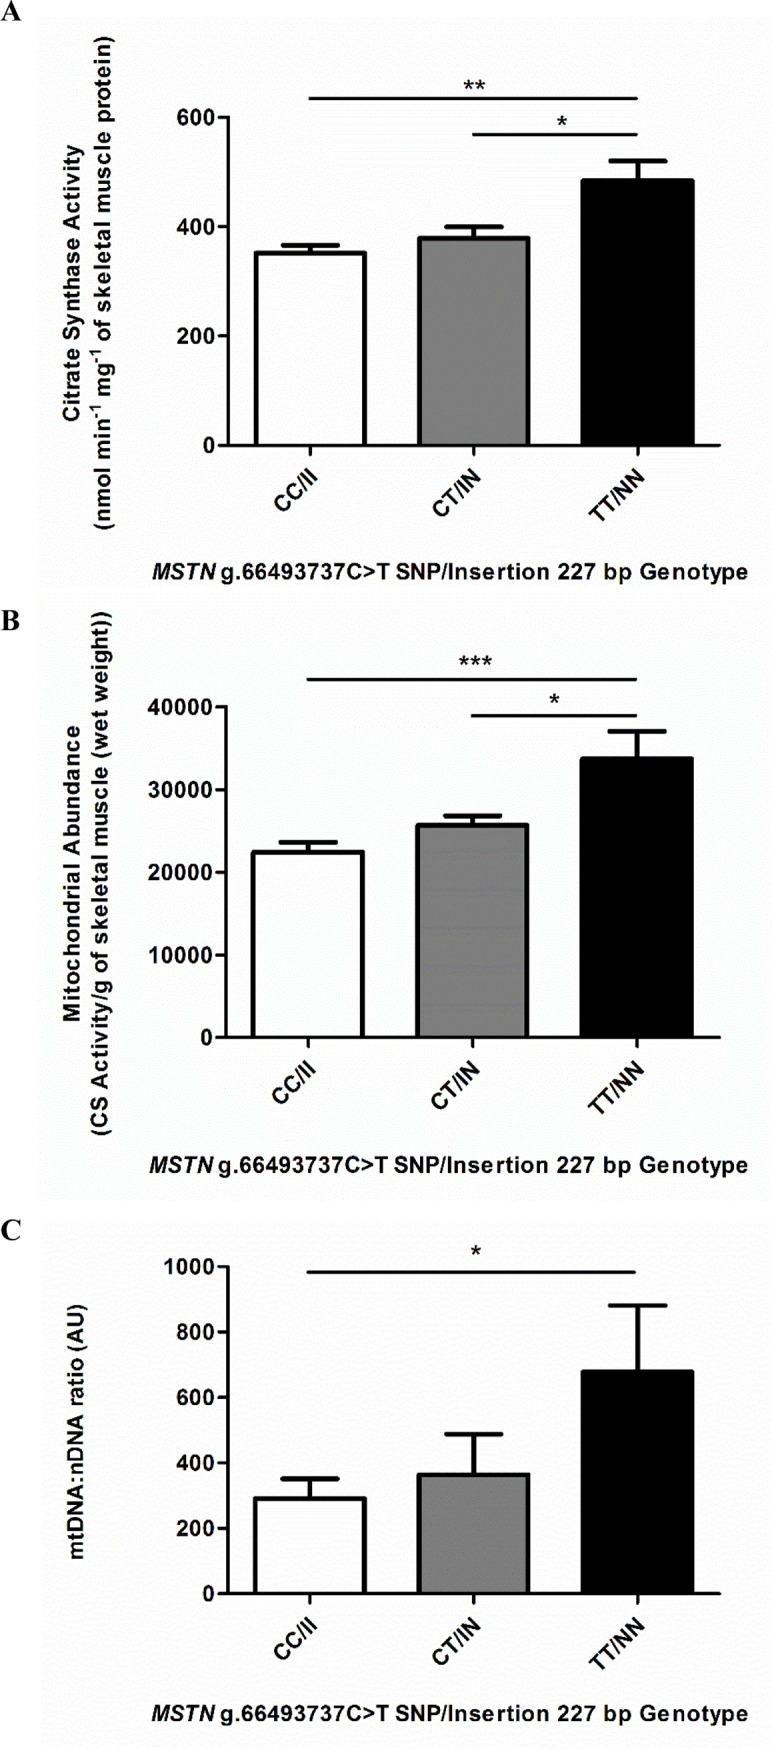
Fig 1. Skeletal muscle mitochondrial content of MSTN genotype (CC/II, CT/IN, TT/NN) horses.

Mitochondrial abundance determined by the activity of citrate synthase (CS) measured spectrophotometrically, expressed (A) as nmol/min/mg of muscle protein and (B) as nmol/min/g of skeletal muscle (wet weight), CC/II: n = 37, CT/IN: n = 32 and TT/NN: n = 11, performed in at least duplicate; and (C) mtDNA:nDNA ratio measured by qPCR, CC/II: n = 19, CT/IN: n = 17 and TT/NN: n = 8, performed in at least triplicate. Results presented with mean ± SEM, p-values where shown indicate significance as measured by a one-way ANOVA with a Bonferroni multiple comparison post-test, * = p ≤ 0.05, ** = p ≤ 0.01, *** = p ≤ 0.001.
