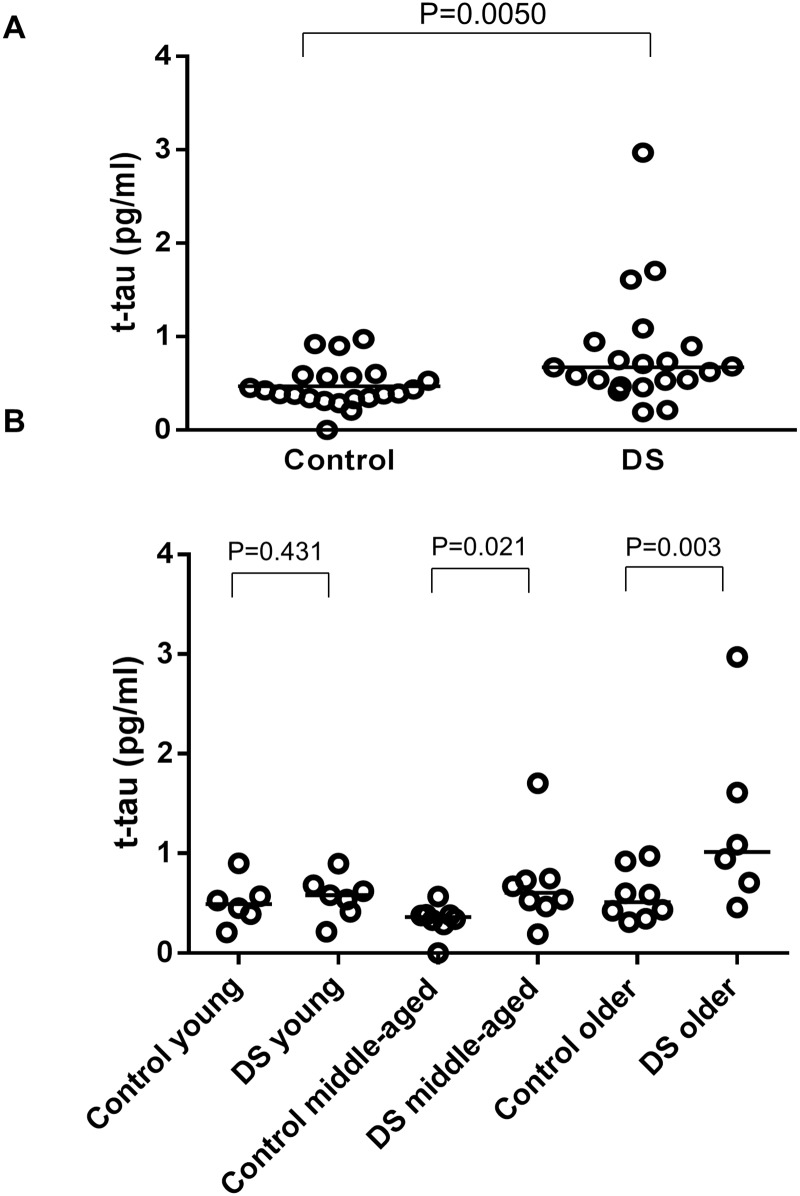
Fig 1.
(A) Scatter plot for t-tau level in plasma in the control group (n = 22) and DS group (n = 21). Bars indicate median values. Levels of t-tau in the DS group were significantly higher than those of the control group (P = 0.0050). (B) Scatter plot for t-tau level in plasma in young generation (ages 14–25 years; n = 6 in the control group and 7 in the DS group), middle-aged generation (ages 26–42 years; n = 8 in the control group and 8 in the DS group), and older generation (aged older than 43 years; n = 8 in the control group and 6 in the DS group) generation. Bars indicate median values. Levels of t-tau in the DS group were significantly higher than those of the control group in the middle-aged generation and the older generation (P = 0.021 and 0.003, respectively).

