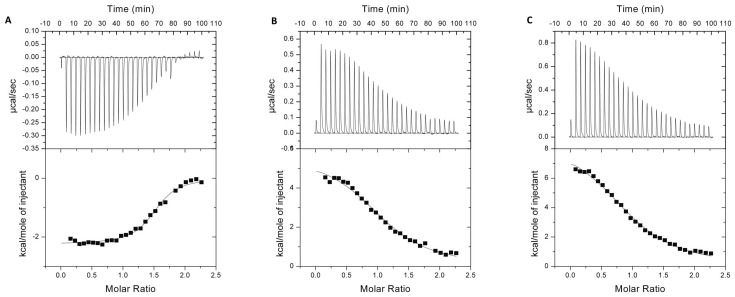
Fig 2. Isothermal titration calorimetry measurements of the E433A variant of PgDPP III with A) angiotensin II, B) tynorphin and C) IVYPW.
The upper panels show the time course evolution of heat for each injection and the bottom panels show peak integration as a function of molar ratio of E433A PgDPP III (inactive variant) to all three ligands. The data were corrected by subtraction of an appropriate blank experiment and fit with nonlinear regression. The solid curves represent the best fits using a one binding site model.

