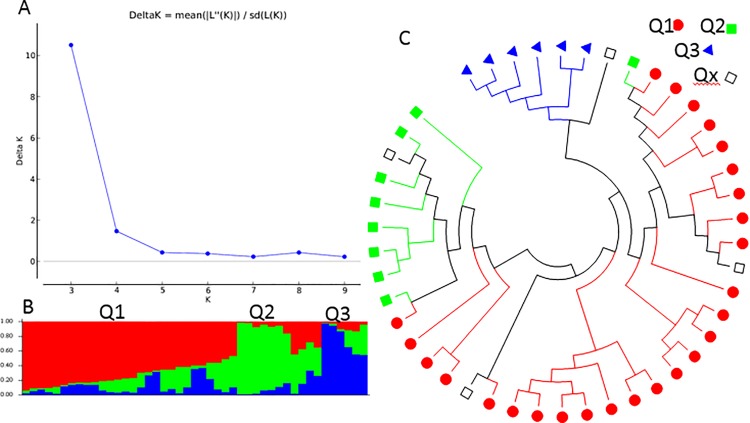
Fig 4.
Model-based populations in association panels consisted of 45 F1 hybrids: (a) Delta K values for different numbers of populations (K) assumed in analysis completed with the STRUCTURE software. (b) Classification of 45 F1 hybrids into two populations using STRUCTURE Version 2.3.4, where the numbers on the y-axis show the subgroup membership, and the x-axis shows the different accession. The distribution of accessions into different populations is indicated by the color coding and shape (Cluster 1, Q1, is red round shape; Cluster 2, Q2, is green squared; and Cluster 3, Q3, is blue triangle). (c) Maximum Likelihood (ML) tree of the 45 F1 hybrids drawn in MEGA 6. The color code for each population is consistent in the (b) and (c), and the empty black square represents accessions aligned with the admixture cluster or population.

