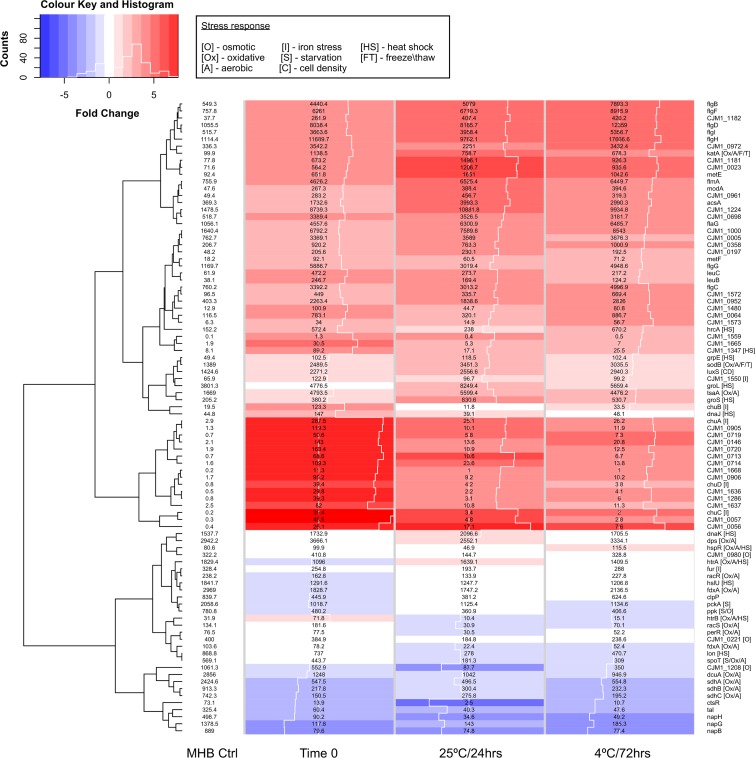
Fig 3. Expression changes in stress-related genes.
The heatmap shows log fold change (logFC) calculated in edgeR compared to the MHB Control (blue = negative, red = positive, the white traceline in the columns indicates the size of the logFC measurement), and displays normalized counts per million (CPM) in numbers. It includes known stress response genes and genes up- or down-regulated ≥2-fold compared to the MHB control based on normalized CPM (numbers displayed in the heatmap matrix) for MHB Control, Time 0, 24 h (25°C) and 72 h(4°C). Square brackets display the type of stress response the gene is involved in (if known). The Histogram in the Colour key indicates the distribution of the data included in the heatmap.

