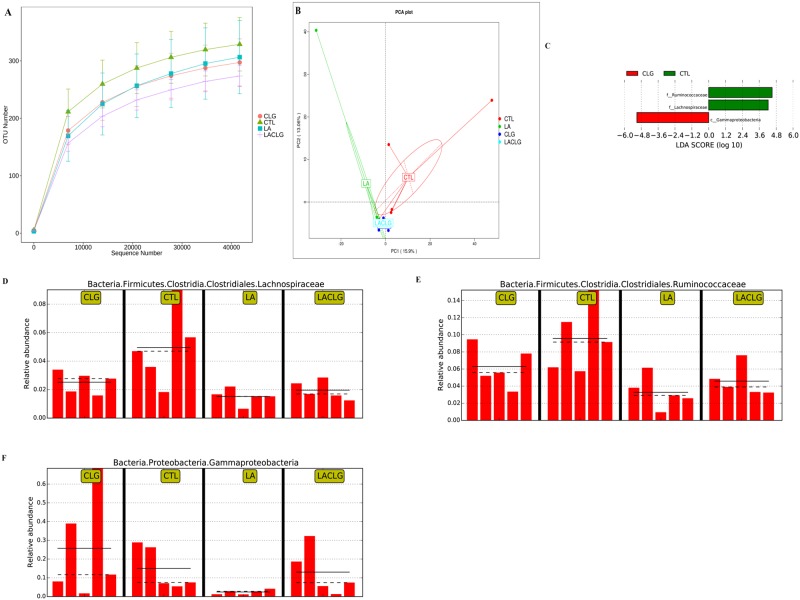
Fig 1. Diversity and composition of ileal microbiota.
Rarefaction curves of the observed OTUs (A) for ileal samples. The community structure among the treatment groups did not differ according to the Principle component analysis (PCA) of 20 ileal samples (B). Linear discriminant analysis (LDA) effect size (LEfSe) showed the phylotypes that differ among treatment groups with statistical and biological significance (C). Histograms indicate the highest relative abundance of the families Lachnospiraceae (D) and Ruminococcaceae (E) in the ileal microbiota of the CTL group, and of the class Gammaproteobacteria (F) in the ileal microbiota of the CLG group. CTL: control group; LA: L. acidophilus supplementation group; CLG: Challenge group; LACLG: challenge group supplemented with L. acidophilus.

