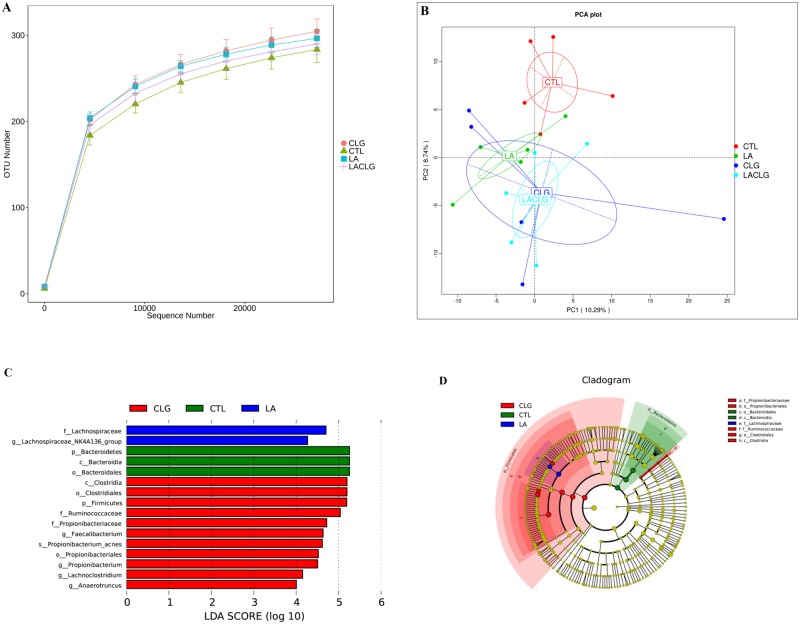
Fig 2. Diversity and composition of cecal microbiota.
There were significant interaction effects of L. acidophilus and the infectious challenge on the number of observed OTUs (A). The PCA plot shows separation of bacterial communities between the CTL group and LA group (R = 0.42, P = 0.024), between the CTL group and CLG group (R = 0.404, P = 0.027), and between the CTL group and LACLG group (R = 0.50, P = 0.012) (B). Key phylotypes in the cecum responding to treatments were identified by the LEfSe algorithm (C). The circular cladogram (D) shows the taxa that are significantly associated with treatments.

