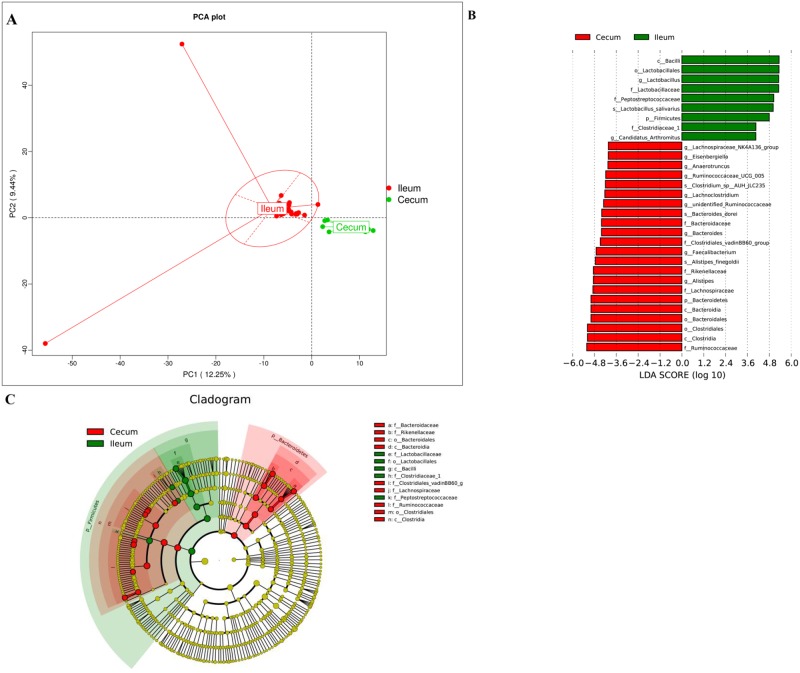
Fig 3. A comparison of diversity and composition between ileal and cecal microbiotas.
The PCA plot (A) shows that the bacterial profile differed strongly by sampling site (R = 0.9138, P = 0.001). Taxa significantly associated with communities of ileum versus cecum were identified by the LEfSe algorithm (B) and are shown in the circular cladogram (C).

