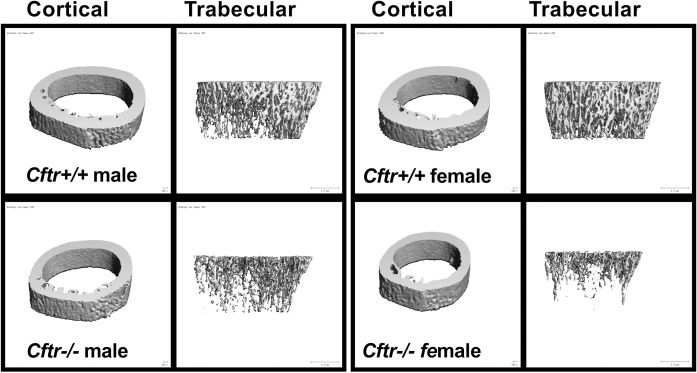
Fig 2. Micro CT imaging demonstrates reduced bone content.
Representative 3D micro CT images of cortical and trabecular bone structures from young Cftr-/- and WT rats. MicroCT images demonstrate reduced bone content in Cftr-/- rats (more predominantly in females and detailed in Table 1). MicroCT images obtained from 38 day old WT and 42 day old Cftr-/- male rats. Female rat microCT images are from 42 day old Cftr-/- and WT rats. MicroCT images are from the male and female rat femurs pictured in histology images (Figs 3 and 4).

